
Advertisement
Research ArticleEndocrinologyMetabolismOncology
Open Access |  10.1172/JCI202725
HSD3B1 links ileal steroid metabolism to bile acid regulation in patients with prostate cancer
Nikou Fotouhi,1,2 Robert Diaz,1,2 Mohammad Alyamani,1,2 Yoon-Mi Chung,1,2 Gail West,3,4 Pranab K. Mukherjee,3 Alireza Abdshah,1,2 Robert A. Burgess,1,2 Samreen Jatana,3 Rana R. McKay,5 Florian Rieder,3,4 Mary-Ellen Taplin,6 and Nima Sharifi1,2
1Desai Sethi Urology Institute and
2Sylvester Comprehensive Cancer Center, University of Miami Miller School of Medicine, Miami, Florida, USA.
3Department of Inflammation and Immunity, Cleveland Clinic Research, and
4Department of Gastroenterology, Hepatology & Nutrition, Digestive Diseases Institute, Cleveland Clinic Foundation, Cleveland, Ohio, USA.
5University of California San Diego, San Diego, California, USA.
6Department of Medical Oncology, Dana-Farber Cancer Institute, Boston, Massachusetts, USA.
Address correspondence to: Nima Sharifi, University of Miami Miller School of Medicine, Desai Sethi Urology Institute, Rosenstiel Medical Science Building, 1600 NW 10th Avenue, room 6026, Miami, Florida 33136, USA. Phone: 305.243.1350; Email: nimasharifi@miami.edu.
Find articles by Fotouhi, N. in: PubMed | Google Scholar
1Desai Sethi Urology Institute and
2Sylvester Comprehensive Cancer Center, University of Miami Miller School of Medicine, Miami, Florida, USA.
3Department of Inflammation and Immunity, Cleveland Clinic Research, and
4Department of Gastroenterology, Hepatology & Nutrition, Digestive Diseases Institute, Cleveland Clinic Foundation, Cleveland, Ohio, USA.
5University of California San Diego, San Diego, California, USA.
6Department of Medical Oncology, Dana-Farber Cancer Institute, Boston, Massachusetts, USA.
Address correspondence to: Nima Sharifi, University of Miami Miller School of Medicine, Desai Sethi Urology Institute, Rosenstiel Medical Science Building, 1600 NW 10th Avenue, room 6026, Miami, Florida 33136, USA. Phone: 305.243.1350; Email: nimasharifi@miami.edu.
Find articles by Diaz, R. in: PubMed | Google Scholar
1Desai Sethi Urology Institute and
2Sylvester Comprehensive Cancer Center, University of Miami Miller School of Medicine, Miami, Florida, USA.
3Department of Inflammation and Immunity, Cleveland Clinic Research, and
4Department of Gastroenterology, Hepatology & Nutrition, Digestive Diseases Institute, Cleveland Clinic Foundation, Cleveland, Ohio, USA.
5University of California San Diego, San Diego, California, USA.
6Department of Medical Oncology, Dana-Farber Cancer Institute, Boston, Massachusetts, USA.
Address correspondence to: Nima Sharifi, University of Miami Miller School of Medicine, Desai Sethi Urology Institute, Rosenstiel Medical Science Building, 1600 NW 10th Avenue, room 6026, Miami, Florida 33136, USA. Phone: 305.243.1350; Email: nimasharifi@miami.edu.
Find articles by Alyamani, M. in: PubMed | Google Scholar
1Desai Sethi Urology Institute and
2Sylvester Comprehensive Cancer Center, University of Miami Miller School of Medicine, Miami, Florida, USA.
3Department of Inflammation and Immunity, Cleveland Clinic Research, and
4Department of Gastroenterology, Hepatology & Nutrition, Digestive Diseases Institute, Cleveland Clinic Foundation, Cleveland, Ohio, USA.
5University of California San Diego, San Diego, California, USA.
6Department of Medical Oncology, Dana-Farber Cancer Institute, Boston, Massachusetts, USA.
Address correspondence to: Nima Sharifi, University of Miami Miller School of Medicine, Desai Sethi Urology Institute, Rosenstiel Medical Science Building, 1600 NW 10th Avenue, room 6026, Miami, Florida 33136, USA. Phone: 305.243.1350; Email: nimasharifi@miami.edu.
Find articles by Chung, Y. in: PubMed | Google Scholar
1Desai Sethi Urology Institute and
2Sylvester Comprehensive Cancer Center, University of Miami Miller School of Medicine, Miami, Florida, USA.
3Department of Inflammation and Immunity, Cleveland Clinic Research, and
4Department of Gastroenterology, Hepatology & Nutrition, Digestive Diseases Institute, Cleveland Clinic Foundation, Cleveland, Ohio, USA.
5University of California San Diego, San Diego, California, USA.
6Department of Medical Oncology, Dana-Farber Cancer Institute, Boston, Massachusetts, USA.
Address correspondence to: Nima Sharifi, University of Miami Miller School of Medicine, Desai Sethi Urology Institute, Rosenstiel Medical Science Building, 1600 NW 10th Avenue, room 6026, Miami, Florida 33136, USA. Phone: 305.243.1350; Email: nimasharifi@miami.edu.
Find articles by West, G. in: PubMed | Google Scholar
1Desai Sethi Urology Institute and
2Sylvester Comprehensive Cancer Center, University of Miami Miller School of Medicine, Miami, Florida, USA.
3Department of Inflammation and Immunity, Cleveland Clinic Research, and
4Department of Gastroenterology, Hepatology & Nutrition, Digestive Diseases Institute, Cleveland Clinic Foundation, Cleveland, Ohio, USA.
5University of California San Diego, San Diego, California, USA.
6Department of Medical Oncology, Dana-Farber Cancer Institute, Boston, Massachusetts, USA.
Address correspondence to: Nima Sharifi, University of Miami Miller School of Medicine, Desai Sethi Urology Institute, Rosenstiel Medical Science Building, 1600 NW 10th Avenue, room 6026, Miami, Florida 33136, USA. Phone: 305.243.1350; Email: nimasharifi@miami.edu.
Find articles by Mukherjee, P. in: PubMed | Google Scholar
1Desai Sethi Urology Institute and
2Sylvester Comprehensive Cancer Center, University of Miami Miller School of Medicine, Miami, Florida, USA.
3Department of Inflammation and Immunity, Cleveland Clinic Research, and
4Department of Gastroenterology, Hepatology & Nutrition, Digestive Diseases Institute, Cleveland Clinic Foundation, Cleveland, Ohio, USA.
5University of California San Diego, San Diego, California, USA.
6Department of Medical Oncology, Dana-Farber Cancer Institute, Boston, Massachusetts, USA.
Address correspondence to: Nima Sharifi, University of Miami Miller School of Medicine, Desai Sethi Urology Institute, Rosenstiel Medical Science Building, 1600 NW 10th Avenue, room 6026, Miami, Florida 33136, USA. Phone: 305.243.1350; Email: nimasharifi@miami.edu.
Find articles by Abdshah, A. in: PubMed | Google Scholar
1Desai Sethi Urology Institute and
2Sylvester Comprehensive Cancer Center, University of Miami Miller School of Medicine, Miami, Florida, USA.
3Department of Inflammation and Immunity, Cleveland Clinic Research, and
4Department of Gastroenterology, Hepatology & Nutrition, Digestive Diseases Institute, Cleveland Clinic Foundation, Cleveland, Ohio, USA.
5University of California San Diego, San Diego, California, USA.
6Department of Medical Oncology, Dana-Farber Cancer Institute, Boston, Massachusetts, USA.
Address correspondence to: Nima Sharifi, University of Miami Miller School of Medicine, Desai Sethi Urology Institute, Rosenstiel Medical Science Building, 1600 NW 10th Avenue, room 6026, Miami, Florida 33136, USA. Phone: 305.243.1350; Email: nimasharifi@miami.edu.
Find articles by Burgess, R. in: PubMed | Google Scholar
1Desai Sethi Urology Institute and
2Sylvester Comprehensive Cancer Center, University of Miami Miller School of Medicine, Miami, Florida, USA.
3Department of Inflammation and Immunity, Cleveland Clinic Research, and
4Department of Gastroenterology, Hepatology & Nutrition, Digestive Diseases Institute, Cleveland Clinic Foundation, Cleveland, Ohio, USA.
5University of California San Diego, San Diego, California, USA.
6Department of Medical Oncology, Dana-Farber Cancer Institute, Boston, Massachusetts, USA.
Address correspondence to: Nima Sharifi, University of Miami Miller School of Medicine, Desai Sethi Urology Institute, Rosenstiel Medical Science Building, 1600 NW 10th Avenue, room 6026, Miami, Florida 33136, USA. Phone: 305.243.1350; Email: nimasharifi@miami.edu.
Find articles by
Jatana, S.
in:
PubMed
|
Google Scholar
|

1Desai Sethi Urology Institute and
2Sylvester Comprehensive Cancer Center, University of Miami Miller School of Medicine, Miami, Florida, USA.
3Department of Inflammation and Immunity, Cleveland Clinic Research, and
4Department of Gastroenterology, Hepatology & Nutrition, Digestive Diseases Institute, Cleveland Clinic Foundation, Cleveland, Ohio, USA.
5University of California San Diego, San Diego, California, USA.
6Department of Medical Oncology, Dana-Farber Cancer Institute, Boston, Massachusetts, USA.
Address correspondence to: Nima Sharifi, University of Miami Miller School of Medicine, Desai Sethi Urology Institute, Rosenstiel Medical Science Building, 1600 NW 10th Avenue, room 6026, Miami, Florida 33136, USA. Phone: 305.243.1350; Email: nimasharifi@miami.edu.
Find articles by McKay, R. in: PubMed | Google Scholar
1Desai Sethi Urology Institute and
2Sylvester Comprehensive Cancer Center, University of Miami Miller School of Medicine, Miami, Florida, USA.
3Department of Inflammation and Immunity, Cleveland Clinic Research, and
4Department of Gastroenterology, Hepatology & Nutrition, Digestive Diseases Institute, Cleveland Clinic Foundation, Cleveland, Ohio, USA.
5University of California San Diego, San Diego, California, USA.
6Department of Medical Oncology, Dana-Farber Cancer Institute, Boston, Massachusetts, USA.
Address correspondence to: Nima Sharifi, University of Miami Miller School of Medicine, Desai Sethi Urology Institute, Rosenstiel Medical Science Building, 1600 NW 10th Avenue, room 6026, Miami, Florida 33136, USA. Phone: 305.243.1350; Email: nimasharifi@miami.edu.
Find articles by
Rieder, F.
in:
PubMed
|
Google Scholar
|
1Desai Sethi Urology Institute and
2Sylvester Comprehensive Cancer Center, University of Miami Miller School of Medicine, Miami, Florida, USA.
3Department of Inflammation and Immunity, Cleveland Clinic Research, and
4Department of Gastroenterology, Hepatology & Nutrition, Digestive Diseases Institute, Cleveland Clinic Foundation, Cleveland, Ohio, USA.
5University of California San Diego, San Diego, California, USA.
6Department of Medical Oncology, Dana-Farber Cancer Institute, Boston, Massachusetts, USA.
Address correspondence to: Nima Sharifi, University of Miami Miller School of Medicine, Desai Sethi Urology Institute, Rosenstiel Medical Science Building, 1600 NW 10th Avenue, room 6026, Miami, Florida 33136, USA. Phone: 305.243.1350; Email: nimasharifi@miami.edu.
Find articles by Taplin, M. in: PubMed | Google Scholar
1Desai Sethi Urology Institute and
2Sylvester Comprehensive Cancer Center, University of Miami Miller School of Medicine, Miami, Florida, USA.
3Department of Inflammation and Immunity, Cleveland Clinic Research, and
4Department of Gastroenterology, Hepatology & Nutrition, Digestive Diseases Institute, Cleveland Clinic Foundation, Cleveland, Ohio, USA.
5University of California San Diego, San Diego, California, USA.
6Department of Medical Oncology, Dana-Farber Cancer Institute, Boston, Massachusetts, USA.
Address correspondence to: Nima Sharifi, University of Miami Miller School of Medicine, Desai Sethi Urology Institute, Rosenstiel Medical Science Building, 1600 NW 10th Avenue, room 6026, Miami, Florida 33136, USA. Phone: 305.243.1350; Email: nimasharifi@miami.edu.
Find articles by Sharifi, N. in: PubMed | Google Scholar
Published June 15, 2026 - More info
J Clin Invest. 2026;136(12):e202725. https://doi.org/10.1172/JCI202725.
© 2026 Fotouhi et al. This work is licensed under the Creative Commons Attribution 4.0 International License. To view a copy of this license, visit http://creativecommons.org/licenses/by/4.0/.
Received: November 21, 2025; Accepted: March 26, 2026

-
Results
Androgen deprivation and apalutamide therapy induce reductions in circulating bile acids. To investigate the systemic metabolic consequences of hormonal therapy, we conducted comprehensive untargeted serum metabolomic profiling in prostate cancer patients receiving ADT combined with the AR antagonist apalutamide in the neoadjuvant setting prior to prostatectomy. Unbiased metabolomic analysis revealed extensive therapy-associated metabolic reconfiguration, with striking alterations observed in circulating bile acids (Figure 1). Our targeted metabolomic analyses showed that circulating levels of primary, secondary, and total bile acids declined significantly 28 days after treatment initiation (Figure 1, A and B, and Supplemental Table 1; supplemental material available online with this article; https://doi.org/10.1172/JCI202725DS1). With stratification by HSD3B1 genotype, bile acid profiles exhibited distinct genotype-associated differences, consistent with the enzyme’s role in extragonadal biosynthesis. Notably, patients with homozygous adrenal-permissive inheritance showed a greater decline in primary bile acids, including taurochenodeoxycholic acid (TCDCA), glycochenodeoxycholic acid (GCDCA) and cholic acid (CA), compared with those with homozygous adrenal-restrictive inheritance, as shown in the untargeted analysis (Figure 1C). Across the cohort, median absolute posttreatment changes revealed a 4.6-fold greater reduction in TCDCA, a 1.9-fold greater reduction in GCDCA, and a 2.7-fold greater reduction in cholic acid in adrenal-permissive individuals relative to adrenal-restrictive carriers. To validate these findings, targeted metabolic profiling was performed on an independent cohort of patients receiving ADT plus AR pathway inhibitor for 6 months (26, 27). Consistent with the initial cohort, the second cohort also showed pronounced reduction in circulating primary bile acids, including GCDCA and CA, following therapy, with a more pronounced decline observed in adrenal-permissive individuals (Figure 1D). Together, these data demonstrate that androgen deprivation plus AR inhibitor is associated with reproducible, genotype-dependent reductions in circulating bile acids, highlighting a clinically relevant metabolic alteration associated with systemic androgen suppression.
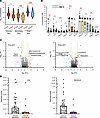 Figure 1
Metabolic profiling of circulating bile acids in patients with prostate cancer receiving ADT plus androgen pathway inhibitor. (A and B) Targeted metabolomic analysis of circulating bile acids (BAs) in 46 patients before and 28 days after treatment demonstrated significant reductions in primary, secondary, and total bile acids, independent of HSD3B1 genotype. (C) Untargeted metabolomic analysis with genotype stratification revealed greater posttreatment declines in homozygous adrenal-permissive (n = 6) compared with homozygous adrenal-restrictive (n = 6) patients, particularly for TCDCA, GCDCA, and CA. Dark blue dots in the graphs represent metabolites that are significantly higher in adrenal-restrictive HSD3B1 genotype, and red dots represent metabolites that are significantly higher in adrenal-permissive HSD3B1 genotype. (D) Targeted metabolomics of an independent cohort (Dana-Farber Cancer Institute) including adrenal-restrictive (n = 35) and adrenal-permissive (n = 8) patients after 6 months of ADT confirmed sustained reductions in CA and GCDCA. Data are presented as median ± SD; Mann-Whitney U test; *P < 0.05, **P < 0.01, ***P < 0.001, ****P < 0.0001.
HSD3B1 and SLC10A2 are exclusively coexpressed and functionally active in human ileal enterocytes. Given the pronounced decline in circulating bile acids in adrenal-permissive prostate cancer patients after ADT plus AR antagonist, we hypothesized that HSD3B1 may contribute to bile acid metabolism or physiology independently of its role in prostate cancer. We suspected that there were 2 mechanisms by which bile acids could be regulated by HSD3B1: regulation of bile acid biosynthesis, which occurs in the liver, or enterohepatic bile acid cycling, which requires intestinal transport. To define the tissue-specific distribution of HSD3B1 expression, we performed an integrated transcriptomic, proteomic, and functional analyses across human gastrointestinal and hepatic tissues. Despite the liver’s canonical role in bile acid biosynthesis, HSD3B1 transcript and protein were undetectable in human liver, hepatocytes, or hepatic carcinoma cell lines (HepG2 and HuH-7) (Supplemental Figure 1, A–C). This absence effectively excludes a role for HSD3B1 in hepatic bile acid biosynthesis. To explore potential compensatory enzymes in hepatocytes, we combined sequence homology, conserved domain alignment, and liver transcriptomic analyses across the HSD3B family. Among these, HSD3B7 displayed the highest sequence similarity and closest phylogenetic proximity to HSD3B1 (28), suggesting possible functional overlap. HEK293T cells stably expressing HSD3B7 converted 7α-hydroxycholesterol (C5) to 7α-hydroxy-4-cholestene-3-one (C4), confirming 3βHSD7 activity in a substrate- and time-dependent manner (Supplemental Figure 2A). In contrast, HSD3B1 knockdown in C4-2 cells did not affect C4 production from C5, indicating that 3βHSD1 cannot substitute for the biochemical function of 3βHSD7 (Supplemental Figure 2B). Moreover, unlike 3βHSD1, HSD3B7-expressing HEK293T cells failed to convert DHEA to AD or testosterone, demonstrating 3βHSD7 lacks steroidogenic activity (Supplemental Figure 2C). Given the absence of hepatic HSD3B1 expression and the lack of compensatory steroidogenic activity by HSD3B7, making it unlikely that HSD3B1 contributes to bile acid biosynthesis, we next explored the second possible mechanism of enterohepatic circulation by examining extrahepatic sites of HSD3B1 expression, focusing on the small intestine, as a potential site of steroidogenic–bile acid crosstalk. Strikingly, scRNA-seq of human intestinal tissues revealed marked enrichment of HSD3B1 in terminal ileal epithelial cells, where it was tightly coexpressed with the apical sodium-dependent bile acid transporter SLC10A2 (ASBT) (Figure 2A). This coexpression signature was absent in hepatocytes or colonic epithelium, designating the terminal ileum as a unique site of 3βHSD1 expression and potential activity. Protein-level validation by IHC and immunofluorescence of human terminal ileum confirmed exclusive colocalization of 3βHSD1 and SLC10A2 in ileal enterocytes, with a distinct crypt-to-villus gradient (Figure 2, B and C, and Supplemental Figure 3, A and B). To assess whether 3βHSD1 is catalytically active in ileal enterocytes, we next employed epithelial enterocyte–relevant in vitro models, including Caco-2 cells and human ileum organoids (HIOs). RT-qPCR and Western blot analyses confirmed robust expression of HSD3B1 and SLC10A2 in both Caco-2 cells and ileal organoids (Figure 2, D–F). Notably, HSD3B1 transcript abundance was substantially higher in Caco-2 cells than in C4-2 prostate cancer cells, consistent with an intestinal physiological role. To complement these molecular observations, functional steroid conversion assays confirmed enzymatic activity of 3βHSD1. Treatment of differentiated Caco-2 monolayers with 100 nM DHEA for 24 h resulted in a rapid production of AD and testosterone, the latter predominantly in the apical compartment (Figure 2G), confirming metabolically active 3βHSD1 in human enterocytes. These findings were also recapitulated in HIOs (Supplemental Figure 4). Importantly, the parallel demonstration of both expression and enzymatic function emphasizes that 3βHSD1 in the intestinal epithelium is not merely a marker of steroidogenic potential but an enzymatically active contributor to local steroid metabolism. Collectively, these results identify the terminal ileum as the exclusive site of HSD3B1 and SLC10A2 coexpression and establish 3βHSD1 as an enzymatically active enterocyte protein, alluding to a potential coordinating role in local steroid metabolism and bile acid uptake.
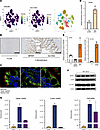 Figure 2
3βHSD1 and SLC10A2 are exclusively coexpressed and functionally active in human ileal enterocytes. (A) scRNA-seq of human gastrointestinal tissues showed selective HSD3B1 enrichment in terminal ileal epithelial cells, overlapping with SLC10A2 (ASBT). (B and C) IHC and immunofluorescence of human liver and terminal ileum (n = 4 independent tissue samples per tissue type) revealed exclusive colocalization of 3βHSD1 and SLC10A2 within enterocytes. Scale bars: 200 μm (B), 5 μm (C). In C, DAPI (blue), 3βHSD1 (green), and SLC10A2 (red). (D) RT-qPCR confirmed HSD3B1 expression in undifferentiated (Undiff.) and differentiated (Diff.) HIOs. (E and F) qRT-PCR and Western blot analyses showed robust coexpression of HSD3B1 and SLC10A2 in Caco-2 cells, with moderate HSD3B1 expression in C4-2 cells. (G) 3βHSD1 metabolic activity in differentiated Caco-2 cells assessed by 24 h DHEA (100 nM) treatment, yielding AD and testosterone (T), indicating enzymatic activity. Data are presented as mean ± SD; n = 3 independent experiments.
LRH-1 drives the intestinal HSD3B1/SLC10A2 coregulation through an AR-independent mechanism. To further delineate regulatory mechanisms governing HSD3B1 and SLC10A2 expression in ileal enterocytes, we first assessed the impact of 3βHSD1 functional disruption using complementary pharmacologic and genetic approaches. Treatment with trilostane (25 μM) (29) or CRISPR-mediated HSD3B1 disruption significantly decreased SLC10A2 mRNA expression (Figure 3A) and attenuated taurocholic acid (TCA) transport in Caco-2 cells, suggesting that HSD3B1 activity is required to maintain bile acid transport capacity in enterocyte models (Figure 3B). We next examined whether AR signaling contributes to HSD3B1 and SLC10A2 regulation in the ileum. Surprisingly, across complementary analytical modalities, no evidence of AR expression was detected in ileal epithelial cells. scRNA-seq (UMAP) analysis of human intestinal tissues revealed no overlap between AR and HSD3B1 expression across epithelial populations (Figure 3C). Consistently, AR transcripts and protein were undetectable in Caco-2 cells and human ileal crypt epithelium by RT-qPCR and Western blot (Figure 3, D and E). These findings excluded AR involvement as a driver of HSD3B1/SLC10A2 regulation in ileal enterocytes and prompted investigation of alternative transcriptional control mechanisms.
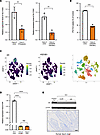 Figure 3
Bile acid transport in ileal enterocytes occurs independently of AR signaling. (A) Chemical inhibition of 3βHSD1 with trilostane (25 μM) or CRISPR/Cas9-disrupted HSD3B1 each significantly reduced SLC10A2 expression in Caco-2 cells. (B) Bile acid uptake assays showed decreased TCA transport in CRISPR/Cas9-disrupted HSD3B1 Caco-2 cells. (C–E) AR was undetectable in human terminal ileum enterocytes. UMAP analysis of intestinal epithelial cells revealed no overlap between AR and HSD3B1, consistent with absence of AR transcript (RT-qPCR) and protein (Western blot) in Caco-2 cells and ileal crypts (n = 3 independent tissue samples). Scale bar: 100 μm. Undifferentiated (Undiff.) and differentiated (Diff.) Caco-2 cells are shown. Data are presented as mean ± SD; n = 3 independent experiments. Statistical significance was determined using a 2-tailed Student’s t test or, for comparisons of more than 2 groups with a common control, 1-way ANOVA followed by Dunnett’s multiple-comparison test; **P < 0.01, ***P < 0.001, ****P < 0.0001.
We therefore turned our focus to NR5A2 (LRH-1), a nuclear receptor with established roles in maintaining intestinal epithelial integrity, homeostasis, and bile acid metabolism, although its function has been more extensively studied and characterized in the liver (25, 30, 31). Expression profiling by RT-qPCR and Western blot showed LRH-1 was robustly and ubiquitously expressed in Caco-2 cells and human ileal crypts (Figure 4, A and B). To test its functional contribution, we inhibited LRH-1 using the selective chemical antagonist ML-180 (10 μM) (32) or generated CRISPR-mediated NR5A2-knockdown alleles. Both approaches significantly reduced HSD3B1 transcripts and 3βHSD1 activity, reflected by decreased DHEA-to-AD and -testosterone conversion (Figure 4, C and D). Parallel analyses revealed that LRH-1 inhibition significantly downregulated SLC10A2 and impaired TCA uptake, suggesting coordinated transcriptional regulation (Figure 4, E and F). Collectively, these results identify LRH-1 as a key upstream regulator of the intestinal HSD3B1/SLC10A2 axis. This LRH-1–dependent pathway operates independently of AR signaling, defining a distinct intestinal transcriptional program that coordinately regulates local steroid metabolism and bile acid transport.
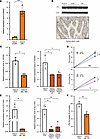 Figure 4
LRH-1 drives the HSD3B1/SLC10A2 axis regulating bile acid transport. (A and B) NR5A2 (LRH-1) was ubiquitously expressed in human ileal crypts and increased during Caco-2 differentiation (n = 4 independent tissue samples). Scale bar: 100 μm. (C and D) LRH-1 inhibition (ML-180, 15 μM) or CRISPR/Cas9 disruption of NR5A2 decreased 3βHSD1 expression and reduced the conversion of DHEA to AD and testosterone (T) in differentiated Caco-2. (E and F) LRH-1 inhibition (ML-180, 10 μM) also significantly reduced SLC10A2 expression and consequently decreased TCA transport. Undifferentiated (Undiff.) and differentiated (Diff.) Caco-2 cells are shown. Data are presented as mean ± SD; n = 3 independent experiments. Statistical significance was determined using a 2-tailed Student’s t test or, for comparisons of more than 2 groups with a common control, 1-way ANOVA followed by Dunnett’s multiple-comparison test; *P < 0.05, **P < 0.01, ***P < 0.001.
LRH-1 maintains intestinal HSD3B1/SLC10A2 regulation independently of glucocorticoid receptor signaling under ADT conditions. Having established LRH-1 as a principal regulator of the HSD3B1/SLC10A2 axis, we next examined the contribution of glucocorticoid receptor (GR) signaling to modulation of this axis in ileal enterocytes, particularly under androgen deprivation conditions. We first profiled GR (NR3C1) expression across in vitro and in vivo models. GR transcripts and protein were detectable in both (un)differentiated Caco-2 cells by RT-qPCR and Western blot and localized predominantly in nuclei in human ileal epithelial crypts, consistent with active GR signaling in this compartment (Figure 5, A and B). We next asked whether LRH-1 regulates GR expression. Pharmacologic LRH-1 inhibition with ML-180 (10 μM) significantly reduced GR transcript and markedly reduced protein abundance, suggesting that GR is, at least in part, under the regulatory influence of LRH-1 (Figure 5C). Despite this regulatory link, we hypothesized that LRH-1 control of SLC10A2 may persist independently of GR, particularly under androgen- and glucocorticoid-depleted conditions. To test this idea, we generated CRISPR-edited NR3C1-deficient Caco-2 cells and cultured them in charcoal-stripped serum medium. Strikingly, under this in vitro modeling condition, SLC10A2 transcript and protein levels remained responsive to LRH-1 perturbation yet were unaffected by GR loss, demonstrating LRH-1–mediated regulation of SLC10A2 independently of GR signaling (Figure 5D). Similar findings were observed following GR antagonist RU486 (mifepristone, 5 and 10 μM) treatment, supporting the notion that SLC10A2 regulation may persist independently of GR activity (Supplemental Figure 5). Given that local glucocorticoid metabolism can strongly shape epithelial steroid signaling, we next profiled the expression of 11β-hydroxysteroid dehydrogenase type 1 (11βHSD1) and 11βHSD2. Both enzymes, especially 11βHSD1, were dynamically regulated during enterocyte differentiation, as shown by RT-qPCR and Western blot (Figure 5E). Intriguingly, LRH-1 inhibition with ML-180 significantly induced HSD11B2 expression at both the mRNA and protein levels (~4-fold) (Figure 5F). Functional metabolic analysis confirmed that this induction was accompanied by a significant increase in 11βHSD2 activity, as reflected by enhanced cortisol-to-cortisone conversion (Figure 5G), suggesting a compensatory shift toward glucocorticoid inactivation. Taken together, these findings demonstrate that while LRH-1 positively controls GR expression, the intestinal HSD3B1/SLC10A2 axis in ileal enterocytes remains independent of GR under in vitro conditions modeling androgen deprivation. LRH-1 inhibition further triggered compensatory HSD11B2 upregulation, enhancing local glucocorticoid inactivation and further uncoupling SLC10A2 regulation from canonical GR signaling. This LRH-1–centered regulatory architecture suggests an adaptive intestinal steroidogenic reprogramming that may contribute to systemic metabolic alterations observed during ADT. We propose that LRH-1 functions as a tissue-intrinsic transcriptional regulator of intestinal steroidogenic and bile acid transport pathways, acting upstream of HSD3B1, HSD11B2, and SLC10A2 and largely independently of GR signaling. In this model, LRH-1 induces HSD3B1 expression, establishing a local steroidogenic program that supports bile acid handling and stabilizes SLC10A2 expression. Importantly, LRH-1–dependent regulation of HSD3B1 and SLC10A2 can persist under conditions in which GR signaling is functionally constrained. In parallel, GR activity in intestinal epithelial cells is limited by LRH-1–controlled expression of 11βHSD2, which promotes glucocorticoid inactivation and restricts direct GR-dependent transcriptional control of SLC10A2. Thus, LRH-1 defines a dominant, GR-independent regulatory axis governing intestinal metabolic reprogramming.
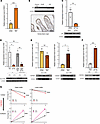 Figure 5
LRH-1 regulates the HSD3B1/SLC10A2 axis independently of GR signaling under in vitro modeling of ADT. (A and B) RT-qPCR and Western blot analyses demonstrated GR expression in undifferentiated and differentiated Caco-2 cells. IHC of human terminal ileum (n = 4 independent tissue samples) confirmed nuclear GR localization in crypt epithelia. Scale bar: 100 μm. (C) LRH-1 inhibition (ML-180, 10 μM) significantly reduced GR transcript and markedly reduced protein levels, indicating LRH-1–dependent regulation. (D) Under charcoal-stripped serum conditions to model androgen- and glucocorticoid-depleted conditions, SLC10A2 expression remained responsive to LRH-1 inhibition but was unaffected by GR disruption. (E) RT-qPCR and Western blot analyses demonstrated dynamic regulation of HSD11B1 and HSD11B2 during Caco-2 differentiation. (F) ML-180 treatment induced HSD11B2 expression. (G) HPLC-based enzymatic assays using tritiated steroids demonstrated increased 11βHSD2 activity following LRH-1 inhibition, evidenced by enhanced cortisol-to-cortisone conversion in both apical (upper) and basolateral (lower) compartments at 0 and 24 h. Data are presented as mean ± SD; n = 3 independent experiments. Statistical significance was determined using a 2-tailed Student’s t test or, for comparisons of more than 2 groups with a common control, 1-way ANOVA followed by Dunnett’s multiple-comparison test; *P < 0.05, **P < 0.01, ***P < 0.001, ****P < 0.0001.
The LRH-1–driven intestinal steroidogenic circuit supports local metabolic adaptation during androgen deprivation. To synthesize our findings, we propose a working mechanistic model depicting how ADT rewires intestinal bile acid metabolism through an LRH-1/HSD3B1/SLC10A2 regulatory axis (Figure 6, A and B). This model integrates patient genotype–metabolite associations with mechanistic observations derived from human intestinal tissue and epithelial model systems. Under androgen-replete conditions, LRH-1 maintains basal HSD3B1 and SLC10A2 expression in terminal ileal enterocytes, supporting coordinated local steroidogenesis and bile acid uptake in concert with GR. During ADT, germline HSD3B1 adrenal-permissive (1245C) alleles encode a more stable 3βHSD1 variant that efficiently converts adrenal precursors (DHEA) into downstream androgens (AD and testosterone) without requiring increased HSD3B1 transcription. In this context, LRH-1 need not be transcriptionally upregulated to maintain 3βHSD1 activity. LRH-1 also directly regulates SLC10A2 and remains responsive to bile acid/FXR signaling; thus, its net activity and downstream bile acid transport may vary depending on intestinal cues and HSD3B1 genotype. Thus, we propose that adrenal-permissive status may functionally decouple LRH-1–driven HSD3B1 transcription from LRH-1–dependent bile acid transport control, resulting in genotype-associated differences in local bile acid handling. Importantly, we emphasize that this inference is based on mechanistic modeling rather than direct measurement of ileal bile acid flux in prostate cancer patients. Definitive proof of this model requires direct in vivo measurement of ileal LRH-1 activity, steroid conversion, and bile acid pools across HSD3B1 genotypes under ADT conditions. Nevertheless, our integrated human and experimental data support the existence of an intestinal LRH-1/HSD3B1/SLC10A2 circuit that influences local metabolic homeostasis of bile acids and steroids during androgen deprivation and provides a plausible mechanistic framework for genotype-associated gut-systemic metabolic adaptation observed clinically.
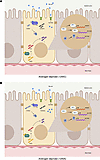 Figure 6
Integrated mechanistic model of intestinal bile acid regulation through the LRH-1/3βHSD1/SLC10A2 axis during ADT. (A and B) Schematic summarizing experimental findings. Under physiologic androgen-replete conditions, LRH-1 sustains HSD3B1 and SLC10A2 expression in terminal ileal enterocytes, supporting efficient bile acid uptake and recycling. LRH-1 also maintains local GR expression, and under androgen-replete conditions, GR signaling contributes to SLC10A2 regulation. During androgen-deprived conditions, adrenal-permissive (HSD3B1 1245C) alleles encode a more stable 3βHSD1 enzyme that efficiently converts DHEA to downstream androgens, reducing dependence on LRH-1–driven HSD3B1 transcription and thereby attenuating LRH-1 activity, including expression of downstream targets such as SLC10A2. In contrast, adrenal-restrictive (HSD3B1 1245A) alleles encode a less stable enzyme, maintaining reliance on LRH-1–mediated HSD3B1 induction, which in turn modestly induces SLC10A2 and other LRH-1 targets. In this context, LRH-1 remains the predominant regulator of the HSD3B1/SLC10A2 axis, while GR signaling becomes functionally uncoupled from SLC10A2 control. Reduced LRH-1 activity induces HSD11B2 and local cortisol inactivation, further reinforcing the insulation of this pathway from canonical glucocorticoid signaling. Together, this model integrates genetic and therapeutic contexts to illustrate an intestinal steroid/bile acid loop during ADT. T, testosterone.


Copyright © 2026 American Society for Clinical Investigation
ISSN: 0021-9738 (print), 1558-8238 (online)