
Advertisement
Research ArticleDevelopmentGastroenterologyOncology
Open Access |  10.1172/JCI197772
Multiomic analyses delineate human neuroendocrine tumor cell states in relation to normal enteroendocrine cell ontogeny
Pratik N.P. Singh,1,2,3 Elsa Hadj Bachir,1,2,3 James R. Howe,4 Andrew M. Bellizzi,5 Paloma Cejas,2 Shariq Madha-Krause,1 Charles B. Epstein,6 Jennifer A. Chan,1,3 Bradley Bernstein,6,7,8 Matthew H. Kulke,1,3 Qiao Zhou,9 and Ramesh A. Shivdasani1,2,3
1Department of Medical Oncology and
2Center for Functional Cancer Epigenetics, Dana-Farber Cancer Institute, Boston, Massachusetts, USA.
3Department of Medicine, Harvard Medical School, Boston, Massachusetts, USA.
4Department of Surgery and
5Department of Pathology, Carver College of Medicine, University of Iowa, Iowa City, Iowa, USA.
6Epigenomics Program, Broad Institute of Harvard and MIT, Cambridge, Massachusetts, USA.
7Department of Cancer Biology, Dana-Farber Cancer Institute, Boston, Massachusetts, USA.
8Department of Pathology, Harvard Medical School, Boston, Massachusetts, USA.
9Division of Regenerative Medicine and Hartman Institute for Therapeutic Organ Regeneration, Department of Medicine, Weill Cornell Medicine, New York, New York, USA.
Address correspondence to: Ramesh A. Shivdasani, Dana-Farber Cancer Institute, 450 Brookline Avenue, Boston, Massachusetts 02215, USA. Phone: 617.632.5746; Email: ramesh_shivdasani@dfci.harvard.edu.
Find articles by Singh, P. in: PubMed | Google Scholar
1Department of Medical Oncology and
2Center for Functional Cancer Epigenetics, Dana-Farber Cancer Institute, Boston, Massachusetts, USA.
3Department of Medicine, Harvard Medical School, Boston, Massachusetts, USA.
4Department of Surgery and
5Department of Pathology, Carver College of Medicine, University of Iowa, Iowa City, Iowa, USA.
6Epigenomics Program, Broad Institute of Harvard and MIT, Cambridge, Massachusetts, USA.
7Department of Cancer Biology, Dana-Farber Cancer Institute, Boston, Massachusetts, USA.
8Department of Pathology, Harvard Medical School, Boston, Massachusetts, USA.
9Division of Regenerative Medicine and Hartman Institute for Therapeutic Organ Regeneration, Department of Medicine, Weill Cornell Medicine, New York, New York, USA.
Address correspondence to: Ramesh A. Shivdasani, Dana-Farber Cancer Institute, 450 Brookline Avenue, Boston, Massachusetts 02215, USA. Phone: 617.632.5746; Email: ramesh_shivdasani@dfci.harvard.edu.
Find articles by Hadj Bachir, E. in: PubMed | Google Scholar
1Department of Medical Oncology and
2Center for Functional Cancer Epigenetics, Dana-Farber Cancer Institute, Boston, Massachusetts, USA.
3Department of Medicine, Harvard Medical School, Boston, Massachusetts, USA.
4Department of Surgery and
5Department of Pathology, Carver College of Medicine, University of Iowa, Iowa City, Iowa, USA.
6Epigenomics Program, Broad Institute of Harvard and MIT, Cambridge, Massachusetts, USA.
7Department of Cancer Biology, Dana-Farber Cancer Institute, Boston, Massachusetts, USA.
8Department of Pathology, Harvard Medical School, Boston, Massachusetts, USA.
9Division of Regenerative Medicine and Hartman Institute for Therapeutic Organ Regeneration, Department of Medicine, Weill Cornell Medicine, New York, New York, USA.
Address correspondence to: Ramesh A. Shivdasani, Dana-Farber Cancer Institute, 450 Brookline Avenue, Boston, Massachusetts 02215, USA. Phone: 617.632.5746; Email: ramesh_shivdasani@dfci.harvard.edu.
Find articles by Howe, J. in: PubMed | Google Scholar
1Department of Medical Oncology and
2Center for Functional Cancer Epigenetics, Dana-Farber Cancer Institute, Boston, Massachusetts, USA.
3Department of Medicine, Harvard Medical School, Boston, Massachusetts, USA.
4Department of Surgery and
5Department of Pathology, Carver College of Medicine, University of Iowa, Iowa City, Iowa, USA.
6Epigenomics Program, Broad Institute of Harvard and MIT, Cambridge, Massachusetts, USA.
7Department of Cancer Biology, Dana-Farber Cancer Institute, Boston, Massachusetts, USA.
8Department of Pathology, Harvard Medical School, Boston, Massachusetts, USA.
9Division of Regenerative Medicine and Hartman Institute for Therapeutic Organ Regeneration, Department of Medicine, Weill Cornell Medicine, New York, New York, USA.
Address correspondence to: Ramesh A. Shivdasani, Dana-Farber Cancer Institute, 450 Brookline Avenue, Boston, Massachusetts 02215, USA. Phone: 617.632.5746; Email: ramesh_shivdasani@dfci.harvard.edu.
Find articles by Bellizzi, A. in: PubMed | Google Scholar
1Department of Medical Oncology and
2Center for Functional Cancer Epigenetics, Dana-Farber Cancer Institute, Boston, Massachusetts, USA.
3Department of Medicine, Harvard Medical School, Boston, Massachusetts, USA.
4Department of Surgery and
5Department of Pathology, Carver College of Medicine, University of Iowa, Iowa City, Iowa, USA.
6Epigenomics Program, Broad Institute of Harvard and MIT, Cambridge, Massachusetts, USA.
7Department of Cancer Biology, Dana-Farber Cancer Institute, Boston, Massachusetts, USA.
8Department of Pathology, Harvard Medical School, Boston, Massachusetts, USA.
9Division of Regenerative Medicine and Hartman Institute for Therapeutic Organ Regeneration, Department of Medicine, Weill Cornell Medicine, New York, New York, USA.
Address correspondence to: Ramesh A. Shivdasani, Dana-Farber Cancer Institute, 450 Brookline Avenue, Boston, Massachusetts 02215, USA. Phone: 617.632.5746; Email: ramesh_shivdasani@dfci.harvard.edu.
Find articles by
Cejas, P.
in:
PubMed
|
Google Scholar
|

1Department of Medical Oncology and
2Center for Functional Cancer Epigenetics, Dana-Farber Cancer Institute, Boston, Massachusetts, USA.
3Department of Medicine, Harvard Medical School, Boston, Massachusetts, USA.
4Department of Surgery and
5Department of Pathology, Carver College of Medicine, University of Iowa, Iowa City, Iowa, USA.
6Epigenomics Program, Broad Institute of Harvard and MIT, Cambridge, Massachusetts, USA.
7Department of Cancer Biology, Dana-Farber Cancer Institute, Boston, Massachusetts, USA.
8Department of Pathology, Harvard Medical School, Boston, Massachusetts, USA.
9Division of Regenerative Medicine and Hartman Institute for Therapeutic Organ Regeneration, Department of Medicine, Weill Cornell Medicine, New York, New York, USA.
Address correspondence to: Ramesh A. Shivdasani, Dana-Farber Cancer Institute, 450 Brookline Avenue, Boston, Massachusetts 02215, USA. Phone: 617.632.5746; Email: ramesh_shivdasani@dfci.harvard.edu.
Find articles by Madha-Krause, S. in: PubMed | Google Scholar
1Department of Medical Oncology and
2Center for Functional Cancer Epigenetics, Dana-Farber Cancer Institute, Boston, Massachusetts, USA.
3Department of Medicine, Harvard Medical School, Boston, Massachusetts, USA.
4Department of Surgery and
5Department of Pathology, Carver College of Medicine, University of Iowa, Iowa City, Iowa, USA.
6Epigenomics Program, Broad Institute of Harvard and MIT, Cambridge, Massachusetts, USA.
7Department of Cancer Biology, Dana-Farber Cancer Institute, Boston, Massachusetts, USA.
8Department of Pathology, Harvard Medical School, Boston, Massachusetts, USA.
9Division of Regenerative Medicine and Hartman Institute for Therapeutic Organ Regeneration, Department of Medicine, Weill Cornell Medicine, New York, New York, USA.
Address correspondence to: Ramesh A. Shivdasani, Dana-Farber Cancer Institute, 450 Brookline Avenue, Boston, Massachusetts 02215, USA. Phone: 617.632.5746; Email: ramesh_shivdasani@dfci.harvard.edu.
Find articles by Epstein, C. in: PubMed | Google Scholar
1Department of Medical Oncology and
2Center for Functional Cancer Epigenetics, Dana-Farber Cancer Institute, Boston, Massachusetts, USA.
3Department of Medicine, Harvard Medical School, Boston, Massachusetts, USA.
4Department of Surgery and
5Department of Pathology, Carver College of Medicine, University of Iowa, Iowa City, Iowa, USA.
6Epigenomics Program, Broad Institute of Harvard and MIT, Cambridge, Massachusetts, USA.
7Department of Cancer Biology, Dana-Farber Cancer Institute, Boston, Massachusetts, USA.
8Department of Pathology, Harvard Medical School, Boston, Massachusetts, USA.
9Division of Regenerative Medicine and Hartman Institute for Therapeutic Organ Regeneration, Department of Medicine, Weill Cornell Medicine, New York, New York, USA.
Address correspondence to: Ramesh A. Shivdasani, Dana-Farber Cancer Institute, 450 Brookline Avenue, Boston, Massachusetts 02215, USA. Phone: 617.632.5746; Email: ramesh_shivdasani@dfci.harvard.edu.
Find articles by Chan, J. in: PubMed | Google Scholar
1Department of Medical Oncology and
2Center for Functional Cancer Epigenetics, Dana-Farber Cancer Institute, Boston, Massachusetts, USA.
3Department of Medicine, Harvard Medical School, Boston, Massachusetts, USA.
4Department of Surgery and
5Department of Pathology, Carver College of Medicine, University of Iowa, Iowa City, Iowa, USA.
6Epigenomics Program, Broad Institute of Harvard and MIT, Cambridge, Massachusetts, USA.
7Department of Cancer Biology, Dana-Farber Cancer Institute, Boston, Massachusetts, USA.
8Department of Pathology, Harvard Medical School, Boston, Massachusetts, USA.
9Division of Regenerative Medicine and Hartman Institute for Therapeutic Organ Regeneration, Department of Medicine, Weill Cornell Medicine, New York, New York, USA.
Address correspondence to: Ramesh A. Shivdasani, Dana-Farber Cancer Institute, 450 Brookline Avenue, Boston, Massachusetts 02215, USA. Phone: 617.632.5746; Email: ramesh_shivdasani@dfci.harvard.edu.
Find articles by Bernstein, B. in: PubMed | Google Scholar
1Department of Medical Oncology and
2Center for Functional Cancer Epigenetics, Dana-Farber Cancer Institute, Boston, Massachusetts, USA.
3Department of Medicine, Harvard Medical School, Boston, Massachusetts, USA.
4Department of Surgery and
5Department of Pathology, Carver College of Medicine, University of Iowa, Iowa City, Iowa, USA.
6Epigenomics Program, Broad Institute of Harvard and MIT, Cambridge, Massachusetts, USA.
7Department of Cancer Biology, Dana-Farber Cancer Institute, Boston, Massachusetts, USA.
8Department of Pathology, Harvard Medical School, Boston, Massachusetts, USA.
9Division of Regenerative Medicine and Hartman Institute for Therapeutic Organ Regeneration, Department of Medicine, Weill Cornell Medicine, New York, New York, USA.
Address correspondence to: Ramesh A. Shivdasani, Dana-Farber Cancer Institute, 450 Brookline Avenue, Boston, Massachusetts 02215, USA. Phone: 617.632.5746; Email: ramesh_shivdasani@dfci.harvard.edu.
Find articles by Kulke, M. in: PubMed | Google Scholar
1Department of Medical Oncology and
2Center for Functional Cancer Epigenetics, Dana-Farber Cancer Institute, Boston, Massachusetts, USA.
3Department of Medicine, Harvard Medical School, Boston, Massachusetts, USA.
4Department of Surgery and
5Department of Pathology, Carver College of Medicine, University of Iowa, Iowa City, Iowa, USA.
6Epigenomics Program, Broad Institute of Harvard and MIT, Cambridge, Massachusetts, USA.
7Department of Cancer Biology, Dana-Farber Cancer Institute, Boston, Massachusetts, USA.
8Department of Pathology, Harvard Medical School, Boston, Massachusetts, USA.
9Division of Regenerative Medicine and Hartman Institute for Therapeutic Organ Regeneration, Department of Medicine, Weill Cornell Medicine, New York, New York, USA.
Address correspondence to: Ramesh A. Shivdasani, Dana-Farber Cancer Institute, 450 Brookline Avenue, Boston, Massachusetts 02215, USA. Phone: 617.632.5746; Email: ramesh_shivdasani@dfci.harvard.edu.
Find articles by Zhou, Q. in: PubMed | Google Scholar
1Department of Medical Oncology and
2Center for Functional Cancer Epigenetics, Dana-Farber Cancer Institute, Boston, Massachusetts, USA.
3Department of Medicine, Harvard Medical School, Boston, Massachusetts, USA.
4Department of Surgery and
5Department of Pathology, Carver College of Medicine, University of Iowa, Iowa City, Iowa, USA.
6Epigenomics Program, Broad Institute of Harvard and MIT, Cambridge, Massachusetts, USA.
7Department of Cancer Biology, Dana-Farber Cancer Institute, Boston, Massachusetts, USA.
8Department of Pathology, Harvard Medical School, Boston, Massachusetts, USA.
9Division of Regenerative Medicine and Hartman Institute for Therapeutic Organ Regeneration, Department of Medicine, Weill Cornell Medicine, New York, New York, USA.
Address correspondence to: Ramesh A. Shivdasani, Dana-Farber Cancer Institute, 450 Brookline Avenue, Boston, Massachusetts 02215, USA. Phone: 617.632.5746; Email: ramesh_shivdasani@dfci.harvard.edu.
Find articles by Shivdasani, R. in: PubMed | Google Scholar
Published May 21, 2026 - More info
J Clin Invest. 2026;136(13):e197772. https://doi.org/10.1172/JCI197772.
© 2026 Singh et al. This work is licensed under the Creative Commons Attribution 4.0 International License. To view a copy of this license, visit http://creativecommons.org/licenses/by/4.0/.
Received: July 9, 2025; Accepted: May 20, 2026


-
Introduction
Cancer cell composition with respect to normal tissues informs understanding, classification, and treatment. In self-renewing tissues like colonic epithelium, bone marrow, and brain, tumor cells phenocopy specific progenitor states. Colorectal carcinomas with neuroendocrine (NE) features are related to those with colonocyte and goblet cell dominance but portend a poor prognosis (1, 2). In contrast, NE tumors (NETs), the most common malignancy in the small intestine (SI), are initially indolent (3), harbor morphologically uniform cells that resemble enteroendocrine cells (EECs; Figure 1A) (4), and lack mutations found in carcinomas (5). Instead, parts of chromosome 18 are commonly lost and 8%–12% of cases have inactivating mutations in the cell cycle inhibitory gene CDKN1B (6–9). There are 2 major normal types of EECs: serotonin-producing TPH1+ enterochromaffin (EC) cells and peptide hormone–producing non-EC cells (10). SI-NETs typically express TPH1 and vasoactive amines (11).
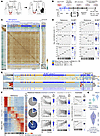 Figure 1
Correspondence of SI-NETs with stages in normal human EEC differentiation from bulk RNA-seq analysis. See also Supplemental Figures 1 and 2. (A) SI-NETs resemble EECs, rare differentiated progeny of ISCs. (B) Normal human EEC differentiation mapped in ISC cultures upon NEUROG3ER-T2 activation (18). Tamoxifen (Tam) induces sequential appearance of early and late EEC precursors, which express specific TFs, culminating in diverse hormone-expressing EEC types. (C) Unsupervised hierarchical clustering (Pearson’s correlation) of RNA profiles in 96 primary SI-NETs, with respect to cells along the course of EEC differentiation in vitro (Reference, left). Highly correlated samples (group A) resembled normal mature EECs (days 4 and 8 after Tam) more than progenitors or immature EECs (days 0–2 after Tam). Group B was mixed and divergent. Batch effects were excluded, and tumors did not cluster by histologic grade (where known): *grade 1, **grade 2, ***grade 3. (D) Normalized DeSeq2 counts (log10 scale) reveal expression of classic NE markers (CHGA, SYP, NCAM1) in both SI-NET groups and EC markers (TPH1, FEV) in group A. Low MKI67 levels exceed those in mature NE cells. Colors indicate institutional sources. (E) Relative expression of transcripts that appear late in normal EC (top) and non-EC (bottom) differentiation (Reference, left). Group A SI-NETs express advanced EC markers, e.g., TPH1, FEV, and DDC; both groups largely lack non-EC markers, e.g., ISL1, ARX, PAX6, and SST. (F) SI-NET expression (medians across 82 group A tumors, excluding CU204, CU176, and CU190) of genes expressed differentially during normal EEC differentiation from day 0 (D0) to D8. About one-quarter of 1,160 ISC-enriched transcripts (e.g., MYC, TMC5) and one-fifth of 1,306 genes expressed transiently between D1 and D3 (e.g., SERPINA1, RARRES3) are enriched (>2-fold, q < 0.05) in SI-NETs compared with terminal EECs. Conversely, 1,376 of 1,536 genes expressed after D4 are expressed. (G) Top: distinct waves of RNA expression mark progenitor/stem (ISC), intermediate (precursor, Inter.), and terminally mature EE cells. Bottom: SI-NETs coexpress early-stage and mature EEC markers. The box-and-whisker plots depict the minimum and maximum values (whiskers), the upper and lower quartiles, and the median.
Because EECs comprise <1% of SI epithelium, comparison of SI-NETs to intestinal tissue simply highlights their EEC properties (12), yielding limited insight into SI-NET biology (13–15). EEC precursors are even sparser in vivo or in intestinal organoids; whereas NE carcinomas (NECs) and pulmonary NETs can spawn organoids, SI-NETs resist long-term culture (16, 17). In 2D cultures of human ileal stem-like cells (hISCs), however, mouse embryonic fibroblasts preserve hISC multipotency, and transient, tamoxifen-induced activation of the transcription factor (TF) NEUROG3 — expressed at near-physiologic levels — triggers the spectrum of EEC differentiation (18), from secretory progenitors (Sec-pro) to mature EC and non-EC cells (Figure 1B). Gene activity, sites of open chromatin, and TF dynamics and requirements identified in this model at single-nucleus resolution (18) provide an authentic ontogenic framework to compare SI-NETs with normal EECs and their precursors. Here, we relate the resulting knowledge of normal EEC ontogeny to mRNA and chromatin phenotypes of human SI-NETs. Our findings shed light on a cis-regulatory basis for unique tumor properties.
In normal EEC precursors, ASCL1 expression oscillates with that of HES6. The TF genes NEUROD1 and NKX2-2, repressed during that period, appear after ASCL1 levels fall; thereafter, additional TFs regulate terminal differentiation of EC cells and distinct non-EC subtypes (Figure 1B) (18). Notably, absence of ASCL1 accelerates EEC maturation, yielding abnormal terminal cells with mixed EC and non-EC features (18). ASCL1, NEUROD1, and TFs expressed in mature EECs are also pivotal in fetal neurogenesis and adult NE differentiation in other tissues, typically acting downstream or parallel to NEUROG3 (19, 20). Of the 5 molecular classes of transcriptionally convergent NE carcinomas from 18 tissues (excluding SI-NETs), the 3 major classes predominantly express ASCL1, NEUROD1, or both genes, as well as SOX2, INSM1, ISL1, ARX, and other TFs that appear at different steps in the normal EEC trajectory (21). ASCL1 or NEUROD1 is prominent in most small-cell lung cancers (22) and castration-resistant NE prostate cancers (23), and prostate cancer progression to a NE phenotype requires ASCL1 (24, 25). ASCL1 or NEUROD1 overexpression frees intestinal organoids from growth factor dependencies, irrespective of oncogenic pathway mutations (16, 17). In contrast, ASCL1 and NEUROD1 expression and activities remain uncharacterized in SI-NETs and are among the features we examined with respect to normal EEC differentiation.
-
Results
SI-NET transcriptomes resemble terminal EECs with substantial elements of normal intestinal stem and progenitor cells. To identify the position that SI-NET cells might occupy along the continuum of hISCNeurog3 differentiation into EECs (18), we profiled 18 primary SI-NETs by RNA-seq and considered additional data from 34 independent (dbGaP: phs001772.v3.p2) and 44 reported (26) mRNA profiles. After we aligned and normalized sequencing reads uniformly and assessed Pearson’s correlation among global mRNA profiles, a Euclidean distance metric revealed 2 SI-NET groups. Overall, while group B was divergent and heterogeneous (Supplemental Figure 1A; supplemental material available online with this article; https://doi.org/10.1172/JCI197772DS1), the 88.5% of samples in group A were transcriptionally similar, varying in rough correlation with specimen sources. After reducing this batch effect using surrogate variable analysis (SVA) (27), samples did not correlate by institutional source or tumor grade. We compared these SVA-corrected profiles with bulk RNA-seq data from human EEC differentiation in vitro (Figure 1C). Untreated hISCNeurog3 cells and those profiled 1 day after tamoxifen-induced NEUROG3 activation — corresponding to Sec-pro (18) — were poorly correlated with any SI-NETs, whereas maturing and terminal EECs (culture days 3–8) were strongly correlated (Figure 1C). GSEA (28) of the 500 most abundant genes on average in group A tumors revealed enrichment of mature EEC genes and depletion of those from stem/progenitor cells (Supplemental Figure 1B).
Following tamoxifen treatment of hISCNeurog3 cells, classic NE (e.g., CHGA, SYP, NCAM1) and EC (e.g., TPH1, FEV) genes appear only after MKI67 and other markers of cell replication decline (Figure 1D). However, SI-NETs coexpressed some level of MKI67 with high SYP and NCAM1, and group A carried uniformly high levels of CHGA and classic EC markers (Figure 1D and Supplemental Figure 1A). Among other EC and non-EC markers from the hISCNeurog3 axis (Supplemental Figure 1C), group A was consistently enriched (>2-fold, q < 0.05) for EC-selective genes (e.g., DDC, OR51E1, MCOLN3, PCSK1, SLC18A1; Supplemental Figure 1D); only 3 outliers (CU204, CU176, CU190) also expressed high levels of non-EC markers (Figure 1E). In contrast, group B was enriched for genes expressed in normal EEC precursors (e.g., ASCL1, SOX2, CALCA, JUN, IL23A; Supplemental Figure 1, D and E). Eight of the 11 tumors in group B were from a multi-institution study in which many samples were annotated sparsely (26). Two samples from another collection carried either abundant stroma or a high MKI67+ cell fraction, and unlike group A tumors, these samples expressed CHGA or TPH1, but not both (Supplemental Figure 2, A and B). Owing to the atypical features and marked heterogeneity of group B, we focus henceforth on the 82 typical low-grade SI-NETs in group A. Nearly 90% of transcripts enriched in mature EECs, i.e., 4 days after NEUROG3 activation in hISCNeurog3 cells (18), were expressed in SI-NETs (Figure 1F), as were 19.4%–25.5% of genes that are enriched in ISCs or precursor cells (1–3 days after NEUROG3 activation) and suppressed (>2-fold, q < 0.05) after culture day 4 (Figure 1F). Thus, most SI-NETs (group A) resemble mature ECs but retain expression of stem and progenitor cell genes that are inactivated during normal EEC maturation (Figure 1G).
Individual SI-NET cells coexpress progenitor and mature cell features. These findings could mean that SI-NETs carry cells at different stages of EEC maturation or that individual cells coexpress precursor and mature EC genes. To discriminate between these alternatives, we analyzed public scRNA data from 3 primary or metastatic SI-NETs (29, 30) in relation to scRNA data on 12,315 differentiating hISCNeurog3 cells (18) (Supplemental Figure 2C). From the processed SI-NET data, we removed EPCAM– nonepithelial, PTPRC+ immune, and ACTA2+COL1A1+ stromal cells (Supplemental Figure 2D), and, to mitigate technical variance between the remaining 7,100 tumor cells and the hISCNeurog3 differentiation axis, we used Harmony (12) to integrate all scRNA data (Supplemental Figure 2E). Among differentiating cell states, IRF1+ and CREB3L1+ states together represent Sec-pro; ASCL1+, HES6hi, and NEUROD1+ represent EEC precursors; and X, D, and T4 are terminal non-EC types (18). Reflecting proper normalization, housekeeping gene and EPCAM levels were comparable across populations (Supplemental Figure 2E). Primary and metastatic SI-NET cells were largely indistinguishable in k-nearest neighbor analysis, as reported (29, 30), and both clustered closest to mature EECs derived in vitro (Figure 2A). Tumor cells uniformly expressed pan-EEC marker CHGA and EC-restricted TPH1 (Figure 2B and Supplemental Figure 2D), indicating that they represent typical SI-NETs from group A.
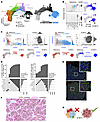 Figure 2
Individual SI-NET cells coexpress stem/progenitor and differentiated EC cell markers and selected non-EC genes. See also Supplemental Figures 2 and 3. (A) UMAP representation of integrated scRNA data from SI-NETs (7,100 epithelial cells from 3 individuals) (29, 30) and from EEC differentiation 24 hours (n = 3,240 cells), 72 hours (n = 1,497), 96 hours (n = 2,727), 120 hours (n = 3,449), and 144 hours (n = 1,402) after Neurog3 activation. Normal cell states (left, colored; right, days after Tam) were described previously (18). SI-NET clusters, designated by source (left) or in blue (right), most resemble mature EE, especially EC, cells. (B) CHGA was expressed in all mature normal EECs, while TPH1 was restricted to mature ECs. Levels of both markers were comparable in primary and metastatic SI-NET single cells. (C) Left: illustrative ISC markers TMC5 (65.9% of ISCs) and CHGA (94.7% of terminal EECs) were mutually exclusive (0.02% coexpression) in normal EECs, but coexpressed (>1 arbitrary unit) in >21% of SI-NET cells; top, distribution; bottom, feature plots. Right: illustrative Sec-pro marker SERPINA1 (33.6% of early precursors) and CHGA coexpress infrequently (12.4% of EECs) in normal differentiation but commonly (> 81% of cells) in SI-NETs. (D) Cumulative distributions of ISC-restricted (left) and Sec-pro (right) markers that coexpress with CHGA in variable fractions of SI-NET cells. Most CHGA+ cells in SI-NETs expressed at least one — usually many — ISC (>83%) and Sec-pro (>96%) markers. (E) PDLIM1 in situ hybridization (red fluorescence) on SI-NET tissue microarrays subsequently immunostained for CHGA (diffuse perinuclear green fluorescence). In 33 of 44 specimens from 10 individuals, nearly all CHGA+ cells showed PDLIM1 puncta that varied in intensity and numbers across samples. Scale bars: 100 μm. Boxed areas magnified in insets. (F) SERPINA1 (pink) and INSM1 (a NE TF; brown) immunostaining in SI-NET microarrays, reflecting uniform coexpression in 42 of 43 specimens from 10 individuals. Scale bar: 50 µm. (G) Group A SI-NETs are not mixtures of cells at different stages of EEC maturity. Rather, phenotypically uniform mature cells retain elements of EEC progenitor states.
We assessed the fraction of CHGAhi cells (>99.8% of tumor cells) that coexpressed (log-normalized counts > 1) stem or progenitor state markers. In line with the low mitotic index of SI-NETs (11) and typical sparsity of scRNA-seq data, we detected MKI67 in only 0.1% and MYC in 1.1% of tumor cells. We therefore considered markers that are highly expressed and enriched in ISCs or Sec-pro but absent in mature normal EECs, especially EC cells, and were detected in SI-NETs by bulk RNA-seq. TMC5, GPRC5A, and PDLIM1, for example, were present in 65.9%, 24.5%, and 37.9% of ISCs, respectively, but in only 0.02%–1.6% of CHGA+ cells differentiated in vitro (scRNA-seq), while SERPINA1 and RAMP1, for example, gave log-normalized counts > 1 in 33.6%–56% of Sec-pro, but only in 5%–12.4% of mature EECs in vitro (Figure 2C and Supplemental Figure 3A). Among SI-NET cells, 21.4% expressed TMC5, 8.5% expressed GPRC5A, and 58.2% expressed PDLIM1; likewise, 41.6%–81.2% of individual SI-NET cells expressed genes that are enriched in Sec-pro (Figure 2C and Supplemental Figure 3A).
Because scRNA-seq does not detect every ISC- or progenitor-restricted gene in every cell classified as such, we considered 10-gene panels that, in aggregate, mark > 93% of ISCs or > 96% of Sec-pro, but < 3% or < 19% of CHGA+ cells in vitro (Supplemental Figure 3B). More than 83% of tumor cells expressed at least 1 ISC marker, usually several, and 96% expressed progenitor genes (Figure 2D). Notably, these markers of undifferentiated cells were distributed broadly and not enriched in any SI-NET subcluster (Figure 2C and Supplemental Figure 3A). Confirming that observation, in situ hybridization detected PDLIM1 transcripts (an ISC marker; Supplemental Figure 3A) in all CHGA+ cells in 33 of 44 SI-NET specimens from 10 individuals (Figure 2E; 11 samples gave no PDLIM1 signal), and immunohistochemistry showed SERPINA1 in all INSM1+ cells in 42 of 43 SI-NET specimens from 10 individuals (Figure 2F). Thus, SI-NETs are not composed of cell populations at different stages of EEC maturity but of phenotypically uniform cells that resemble mature ECs while retaining prominent elements of normal EEC precursor states (Figure 2G).
SI-NET features include non-EC components and tumor-specific genes. Although SI-NETs lack hormones or TFs classically restricted to non-EC cell types (Figure 1E), we considered the possibility of lineage infidelity. Applying strict criteria (>2-fold, q < 0.001, >25% expressing cells) to define EC and non-EC transcripts in pseudobulk scRNA-seq data from hISCNeurog3-derived cells (Figure 3A), we merged these data with log-normalized bulk RNA-seq data on SI-NETs from group A, excluding the 3 outliers that express TF genes associated with non-EC cells (Figure 1E). On average, the 82 SI-NETs expressed 77.1% of EC-enriched and up to 30.9% of non-EC genes (Figure 3A). scRNA-seq data from the 3 SI-NETs confirmed the presence of VSTM2L, CPLX2, and other non-EC transcripts and the absence of ISL1, ARX, and other subtype-specifying TFs (Figure 3B). Thus, although the EC phenotype dominates in SI-NETs, they carry selected features of both progenitor and non-EC cells, reflecting departure from the distinction between EC and non-EC cells in normal EEC differentiation (Figure 3C).
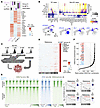 Figure 3
Lineage infidelity and nonphysiologic gene and enhancer activity in SI-NETs. See also Supplemental Figures 3 and 4. (A) Relative expression of EC and non-EC marker genes (averaged across respective scRNA-seq clusters, left 2 columns) in bulk RNA-seq data averaged across SI-NETs (right column) from group A (n = 82 after excluding outliers with overt non-EC features). (B) Examples of EC (e.g., NR5A2, ARC) and non-EC (e.g., ISL1, ARX) markers that are absent and non-EC genes that are expressed (e.g., VSTM2L and CPLX2, shown in the feature plot, others in the dot plot) in scRNA-seq data from SI-NET cells. (C) Differential gene expression distinguishes normal EC from non-EC cells. Although the EC phenotype dominates in SI-NETs, the tumors express many mRNA features of non-EC cells. (D) Relative expression of SI-NET enriched markers (Supplemental Figure 3C) in bulk RNA-seq data during normal EEC differentiation and median expression across 82 group A tumors. (E) Histone modifications H3K27ac (ChIP-seq, n = 10 SI-NET samples) and H3K4me3 (ChIP-seq, n = 3 SI-NETs) and open chromatin (ATAC-seq, n = 3 SI-NETs) at H3K27ac-marked genomic sites identified in ≥3 of 10 tumors. Signals are plotted ±3 kb from ATAC summits. (F) Sorting of H3K27ac-marked sites by signal rank reveals enrichment of enhancers near genes ordinarily expressed in normal ISCs (red; KLF2, KCNK5, etc., as represented below during normal EEC differentiation and in group A SI-NETs), Sec-pro (black; HES1, SOX4, ETS2, IRF1, etc.), and terminal EECs (blue; CHGA, RFX6, NKX2-2, etc.). The box-and-whisker plots depict the minimum and maximum values (whiskers), the upper and lower quartiles, and the median.
Genes such as CDX2, PITX2, and PCSK2 signify the intestinal origins of SI-NETs (31–34), and the reference atlas of normal EEC ontogeny allowed us to identify additional features. SOX5, PRODH2, PITX2, SLC6A15, PEG3, CDH17, and other genes were highly enriched (log2 fold difference > 5, q < 1 × 10⁻⁵) in scRNA-seq analysis of the 3 SI-NETs (Supplemental Figure 3C), and bulk RNA-seq data identified > 500 transcripts enriched in group A SI-NETs compared with normal mature EECs (Figure 3D). CDH17, LMX1A, PITX2, PRODH2, PEG3, and SLC6A15, for example, were low or undetected at any time in differentiating hISCNeurog3 cells but robustly expressed in tumors (Supplemental Figure 3D). PITX2, PCSK2, PRODH2, and GRIA2 are reported prognostic markers (31–35), and CDH17 is a candidate target for CAR T cell therapy for SI-NETs (36). Other genes enriched in the tumors are therefore additional candidate biomarkers.
Progenitor gene activity in SI-NETs is associated with assorted enhancer elements and repression of TFs that specify non-EC cells. Chromatin dynamics of normal EEC differentiation allowed us to interrogate the chromatin basis for gene dysregulation in SI-NETs. To identify cis-elements active in SI-NET, we performed bulk ATAC-seq (assay for transposase-accessible chromatin using sequencing) on 3 tumors, ChIP-seq for H3K27ac on 10 tumors, and ChIP-seq for H3K4me3 in 3 tumors; all SI-NETs were fresh-frozen, with > 80% tumor content. Although ATAC peaks at given sites were often robust, as illustrated below, fractions of DNA reads in ATAC-seq peaks were low, indicating inadequate sensitivity. We therefore used H3K27ac marks to confidently identify 48,488 active sites that were enriched over background signals (q < 0.001) and present in ≥ 3 individual SI-NETs (Figure 3E). These sites correlated with open chromatin, and 12,791 of them carried the promoter mark H3K4me3, while the others represent enhancers (Figure 3E). Ranking these enhancers by H3K27ac signal strength revealed high cis-regulatory activity within 1 Mb of ISC-associated genes, which declined after NEUROG3 activation in hISCNeurog3 cells but were abundantly expressed in SI-NETs (Figure 3F; enhancers attributed to the closest gene; RNA expression examples also shown). Strongly marked enhancers also lie within 2 Mb of genes ordinarily restricted to Sec-pro (e.g., IRF1, HES1, ETS2, SOX4) or to mature EECs (e.g., CHGA, NEUROD1, NKX2-2, RFX6, FOXA2). Thus, SI-NET epigenomes show thousands of active cis-elements that correlate with physiologic and aberrant gene activity.
To determine whether expression aberrancies reflect activity of enhancers that normally act in ISCs and Sec-pro, we analyzed DNA accessibility and H3K27ac marking early after NEUROG3 activation in hISCNeurog3 cells. Among SI-NET enhancers, we observed 4 patterns during normal EEC ontogeny (Figure 4A). Type I sites (7.1%) progressively shed access and H3K27ac soon after NEUROG3 activation and correlated with ISC-enriched gene expression. Type II enhancers (20.1%) were moderately accessible throughout EEC differentiation but lacked H3K27ac on the 3 days we probed with ChIP-seq in vitro. Type III sites (35.3%) gave weak signals in SI-NETs and were neither open nor marked with H3K27ac during EEC differentiation; many of these sites were located near stromal (e.g., COL1A1, ACTA2) or immune (e.g., PTPRC) genes and may reflect stroma present in SI-NET samples. Type IV enhancers (15.1%) progressively acquired access and H3K27ac and associated with mature EEC genes, and the strong tumor signals were compatible with dominant expression of those genes. The remaining sites (type V, 22.4%) were stable across normal EEC differentiation. ATAC signals and relative H3K27ac distributions from days 0 to 3 of normal EEC differentiation were quantified (Supplemental Figure 4A), and sites near stem and progenitor genes that are expressed in SI-NETs were illustrated (Figure 4B). In addition to housing a type I enhancer, KLF2, for example, recruits an additional type III enhancer. Loci highly expressed in SI-NETs but not in native EECs (Figure 3D) carried type II or III sites or both (Figure 4C). Thus, SI-NETs deploy distinct enhancer classes, including de novo sites, to express stem/progenitor and other genes that are ordinarily active or inactive in normal mature EECs (Figure 4D).
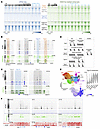 Figure 4
Distinct classes of enhancers associated with SI-NET expression of stem/early precursor cell genes and absence of non-EC genes. See also Supplemental Figure 5. (A) H3K27ac signals at enhancers, clustered based on chromatin accessibility (ATAC-seq, left, n = 3) and H3K27ac marking (right, n = 10). During normal EEC differentiation, type I sites (ISC-enriched, 7.1%) progressively lose accessibility and H3K27ac; type II sites (20.1%) are accessible throughout, but lack H3K27ac in any phase we examined by ChIP-seq; type III sites (35.3%) are inaccessible and lack H3K27ac; type IV sites (15.1%) open and acquire H3K27ac progressively; and type V sites (22.4%) carry marks of enhancer activity throughout. DFCI, Dana-Farber Cancer Institute. (B) IGV tracks illustrating enhancers of types I, II, and III near genes enriched in normal ISCs (D0-1, compared with mature normal EECs, D4-8) that are expressed in SI-NETs. ATAC-seq data represent all samples (n = 3); H3K27ac data represent 3 of 10 samples. (C) Chromatin accessibility and H3K27ac marks in reference EECs and SI-NETs at PITX2 and CDH17, representative genes highly expressed in SI-NETs. The PITX2 locus has enhancers of types II (accessible but lacking H3K27ac in normal EEC differentiation) and III (de novo recruitment in SI-NETs); the CDH17 locus has a type II enhancer. (D) Features of active SI-NET enhancer types in ISCs and mature EECs. (E) Integrated and merged UMAP of scATAC-seq derived cells (n = 18,954) 24 hours, 72 hours, 96 hours, 120 hours, and 144 hours after NEUROG3 activation. The 11 cell clusters correspond to scRNA-seq defined states (Supplemental Figure 2E) by transfer of gene anchors. Right and below: type IV sites accessible in SI-NETs are not specific to any EEC subtype differentiated in vitro. (F) Chromatin accessibility and H3K27ac marks in normal EEC differentiation and SI-NETs at representative non-EC loci. TF genes ISL1, ARX, and PAX6 carry H3K27me3 (3 samples representing n = 5 are shown) and lack H3K27ac in SI-NETs, whereas normal cells show progressively increased accessibility and H3K27ac over the course of EEC differentiation.
Most SI-NETs lack TFs that classically specify non-EC cell types, e.g., ISL1, ARX, and PDX1 (Figure 1E), but express many non-EC features (Figure 3, A and B). To assess whether this is because mature EC and non-EC cells share accessible chromatin (18), we mapped open chromatin in hISCNeurog3 cells isolated 24 hours (n = 1,459 cells), 72 hours (n = 1,543), 96 hours (n = 3,652), 120 hours (n = 5,330), and 144 hours (n = 6,970) after NEUROG3 activation (Supplemental Figure 4B). We transferred gene anchors from scRNA-defined cell clusters across an integrated UMAP of scATAC profiles in single cells from all days (Figure 4E) and used Monocle3 (37) to order clusters in pseudotime (Supplemental Figure 4C). DNA motifs for TFs expressed exclusively in any scRNA cluster, e.g., FOSL2, TEAD, and RELA (early) or NKX2-2, PAX6, and MNX1 (late), were enriched in the corresponding scATAC clusters (Supplemental Figure 4D). Starting with NEUROD1+ cells, however, mature EC and non-EC cell types shared most enhancers and DNA motifs (Supplemental Figure 4, D and E). Even the sites most differently accessible in EC and non-EC cells showed only subtle differences, and SI-NETs showed comparable DNA access and H3K27ac marking across these sites (Supplemental Figure 4E). Type IV enhancers active in tumors marked all mature EECs, not those of a specific subtype (Figure 4E), providing a cis-regulatory basis for lineage infidelity in SI-NETs.
Because SI-NETs nevertheless lack classic non-EC TFs, we examined the repressive histone mark H3K27me3 by ChIP-seq in 5 fresh-frozen tumors. H3K27me3 signal strength at Polycomb targets like the HOXA and HOXB clusters (38) provided benchmarks for stringent repression (Supplemental Figure 5A). Conversely, expressed loci such as CHGA carried H3K27ac and showed background H3K27me3 signals, while linked CDX2 (expressed in SI-NETs) and PDX1 (not expressed) genes showed the range of H3K27me3 at active and silent genes (Supplemental Figure 5B). Differentiating hISCNeurog3 cells acquired accessibility at PDX1, ISL1, ARX, and PAX6 late in EEC ontogeny and H3K27ac marks appeared at the same sites on day 3 in vitro (Figure 4F). SI-NETs lacked open chromatin or H3K27ac at these sites; instead, they carried H3K27me3 at levels comparable with HOX clusters (Figure 4F). Thus, non–EC-associated TF loci show evidence of Polycomb repression in SI-NETs.
Absence of the pivotal ASCL1+ interim cell state. In normal EEC precursors, an ASCL1+SOX2+MYCL+ cell state oscillates with one that lacks these transcripts and expresses high HES6; NEUROD1 is repressed in these precursors, and after its activation, ASCL1 expression persists only in TPH1+ EC cells (18) (Figure 5A). ASCL1-null EECs mature abnormally fast, generating EC cells that express SOX5, a TF gene normally absent at any step in EEC ontogeny, and display mixed EC and non-EC features (18). Because SI-NETs show similar lineage infidelity, we assessed them for the ASCL1+ precursor state, which normally ensures timely and faithful EEC differentiation (18). scRNA analysis of normal EEC differentiation identified genes enriched in each cellular state; in agreement with bulk RNA-seq on successive culture days (Figure 1F), the scRNA-seq data from 3 SI-NETs showed expression of approximately one-third of ISC and Sec-pro markers and approximately one-fifth of precursor and mature EEC markers, expressed at levels lower than in normal EECs (Figure 5B). However, tumor cells notably lacked the interim ASCL1+HES6hi profile (e.g., AGT, SLC2A12, SPON2, PROM1) as well as TF genes (e.g., MYCL, SOX2, NR0B2) that persist with ASCL1 into mature ECs (Figure 5, B–D). Moreover, ASCL1 and SOX2 mRNAs were absent from all group A SI-NETs we examined by bulk RNA-seq, while NEUROD1 and NKX2-2 transcripts were abundant (Figure 5E). Four tumors in group B expressed appreciable levels of ASCL1, SOX2, or both genes, and 6 others lacked NEUROD1 or NKX2-2 (Figure 5E), further justifying our focus on group A tumors in this study. Tissue microarrays containing 79 SI-NETs showed NEUROD1 immunostaining in 87% and absence of ASCL1 in all samples (Figure 5F and Supplemental Figure 6A); in contrast, both TFs were present in 40%–57% of NE carcinomas (Supplemental Figure 6B).
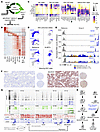 Figure 5
SI-NETs express NEUROD1 but not ASCL1, and epigenetic features account for repression of the ASCL1+ state. See also Supplemental Figure 6. (A) In EEC precursors, HES6hi and ASCL1+ cell states oscillate before NEUROD1+NKX2-2+ preterminal EECs emerge. (B) SI-NET (scRNA-seq primary [Pri] and metastatic [Met] cells) expression of genes enriched at successive steps in EEC differentiation, illustrating persistence of progenitor genes and notable paucity of EEC precursor (ASCL1+HES6hi) markers. (C) Specific genes ordinarily expressed in oscillating ASCL1+HES6hi cells are excluded from Pri or Met SI-NET cells, unlike genes that characterize ISCs, secretory/early EEC precursors, and mature EECs. (D) ASCL1 is absent and HES6 is barely detected in scattered cells in 3 SI-NETs (scRNA-seq). NKX2-2 and NEUROD1 are robustly expressed in mature normal EECs and SI-NET cells. (E) HES6, ASCL1, and genes coexpressed in normal EEC precursors — SOX2 and MYCL — are notably absent from group A SI-NETs (n = 85, bulk RNA-seq, normalized DeSeq2 counts), while NEUROD1 and NKX2-2 are expressed in all cases. Some group B tumors express ASCL1 and lack NEUROD1 or NKX2-2. Bar colors refer to institutional sources of samples. (F) Immunohistochemical validation of ASCL1 absence and NEUROD1 expression in SI-NET tissue microarrays. NEUROD1 immunostaining, seen in 87% of 79 SI-NETs, was typically strong (mean H-score, 177; median, 190); ASCL1 did not stain any of the 79 SI-NETs. Scale bars: 50 μm. (G) Chromatin accessibility and H3K27 marking in normal EEC differentiation and SI-NETs at key representative loci. Precursor markers HES6 and ASCL1 lack H3K27ac; instead, ASCL1 carries broad H3K27me3, indicating epigenetic silencing. Among ASCL1-synexpressed TF loci, SOX2 resembles ASCL1, while MYCL, also silent, has accessible H3K4me3+ promoter DNA but elsewhere lacks H3K27ac or H3K27me3. Similar to normal EECs, NEUROD1 has accessible chromatin and H3K27ac but not H3K27me3 marking. (H) Schematic summaries. Left: normal EEC differentiation. Right: SI-NETs, where ISC and Sec-pro states are less represented than the mature EEC state and absence of the ASCL1+ state may explain accelerated EC differentiation and presence of non-EC elements.
SOX2 was undetectable in SI-NETs, while HES6 and MYCL levels were even lower than those seen in undifferentiated ISCs in vitro (Figure 5, C–E). Instead, SI-NETs expressed SOX5 (Supplemental Figure 6C). During normal EEC differentiation, chromatin near HES6, ASCL1, SOX2, MYCL, and NEUROD1 becomes more accessible and marked with H3K27ac, with variable kinetics (Figure 5G). In SI-NETs, NEUROD1 was accessible and carried H3K27ac, whereas ASCL1 and SOX2 were inaccessible, lacked H3K27ac, and had abundant H3K27me3 (Figure 5G; HES6 and MYCL lacked both H3K27 marks; only their promoters were accessible). SOX5 is inaccessible in normal EEC differentiation, lacked H3K27me3 in tumors, and showed type III (de novo) and type II enhancers (Supplemental Figure 6D). Thus, although SI-NETs retain early differentiation genes, they strictly exclude the ASCL1+ interim state, with Polycomb-mediated silencing of ASCL1 and its coexpressed TF locus SOX2. The simultaneous presence of EC and non-EC features in SI-NETs, coupled with SOX5 expression and ASCL1 absence, evokes the transcriptional and lineage infidelity of ASCL1null cell differentiation (Figure 5H).
Expression and silence of cyclin-dependent kinase inhibitors in SI-NETs. Mono-allelic inactivation of CDKN1B, a cell cycle inhibitor, is the only mutation that recurs in SI-NETs (6, 7). Cyclin-dependent kinases (CDKs) 4/6 or CDK2 form complexes with Cyclin D or E to phosphorylate the retinoblastoma protein (RB), releasing E2F TFs, which trigger DNA synthesis (Figure 6A). “Hallmark E2F targets” was among the top pathways enriched in SI-NETs over terminal (culture day 8) EECs, reflecting a swath of enriched E2F target genes that express in untreated hISCNeurog3 cells and decline upon NEUROG3-induced cell cycle exit (Supplemental Figure 7A). E2F inactivation in vivo is essential to arrest cell replication in intestinal crypt progenitors and terminal EECs, especially EC cells (39, 40). Moreover, SI-NETs express Cyclin and CDK mRNAs at levels higher than those seen in mature normal EECs. CDK1, known to be expressed in SI-NETs (41), lies 32 kb from a type II enhancer, but lacks H3K27ac over the gene body (Supplemental Figure 7B). In contrast, CDK14 and CCND2 levels are higher in SI-NETs than in ISCs or replicating progenitors; the levels are > 1 order of magnitude higher than CDK1. Both loci, especially CDK14, show accessible H3K27ac-marked chromatin (unlike normal mature EECs; Supplemental Figure 7B), and immunohistochemistry detected CDK14 and Cyclin D2 in SI-NET tissues (Supplemental Figure 7C). Thus, cell cycle deregulation is a general feature of SI-NETs, not limited to the approximately 10% of cases with CDKN1B mutation, and implies a requirement for CDKN genes to limit replication. CDKN1B heterozygosity (6–9) further implies that cell cycle control is sensitive to CDKN gene dosage.
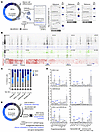 Figure 6
Expression and regulation of CDKN1B and other cell cycle regulators in normal EEC differentiation and SI-NETs. See also Supplemental Figures 7 and 8. (A) CDKs and their inhibitors (CDKi) in cell cycle control and their mRNA expression in SI-NETs. RB phosphorylation by specific CDKs releases E2F to transcribe G1 and S phase genes. NEUROG3 activates CDKN1A, and approximately 10% of SI-NETs have inactivating CDKN1B mutations. Among CDKi genes, SI-NETs express low levels of CDKN2A and CDKN1C. CDKN1A and CDKN1B levels are at least an order of magnitude higher than other CDKN genes; only CDKN1B levels exceed those seen at any stage in normal EEC differentiation. The box-and-whisker plots depict the minimum and maximum values (whiskers), the upper and lower quartiles, and the median. (B) H3K27me3 marking, inaccessible chromatin, and absence of H3K27ac signify epigenetic silencing of CDKN2A, CDKN2B, and CDKN1C loci in SI-NETs. Conversely, CDKN1B lacks H3K27me3, and multiple accessible cis-elements carry H3K27ac marks. CDKN1A lacks H3K27me3 or H3K27ac, but many sites accessible in normal EEC differentiation are inaccessible in SI-NETs. Dashed boxes outline promoters. (C) Cell cycle phases (mean ± SEM, n ≥ 3 independent experiments) in control (scrambled gRNA-edited), ASCL1-null, CDKN1B-null, and double mutant hISCNeurog3 cells. S phase, quantified by EdU flow cytometry in mCherry+ cells, dropped steeply after Tam exposure (Neurog3 activation) in all lines. G2/M phase was prolonged in CDKN1B-null cells. (D) RT-qPCR analysis of ASCL1-null, CDKN1B-null, and double-null hISCNeurog3 cells 6 days after Neurog3 activation, relative to control cells edited with scrambled gRNA. mRNA levels normalized to GAPDH are shown for proliferative and EEC markers and genes expressed in both SI-NETs and in vitro differentiated ASCL1-null cells. Data are shown as mean ± SEM, n ≥ 3 independent experiments; note different y axes (dotted lines mark 2-fold elevations in mRNA). *P < 0.05, **P < 0.01, ***P < 0.001 (2-tailed t test). (E) Proposed basis for SI-NET properties: absence of ASCL1 from epigenetic silencing accelerates terminal EEC differentiation, while epigenetic CDKi repression and CDKN1B mutation may combine to overcome replication arrest in differentiated cells.
As differentiation of hISCNeurog3 cells reveals, replication is curtailed soon after NEUROG3 activation because CDKN1A levels rise transiently, and expression of other CDK inhibitors — CDKN2B, CDKN2A, and CDKN1C — persists (Figure 6A), reflecting progressive promoter and enhancer activity (Figure 6B). While CDKN2C and CDKN2D levels are constitutively low (note log10 y axis scales), CDKN1A and CDKN1B are constitutively high (Figure 6A). SI-NETs express approximately 1 order of magnitude less CDKN1C, CDKN2A, or CDKN2B than mature EECs (Figure 6A), and all 3 loci carry extensive H3K27me3 (Figure 6B). Conversely, SI-NETs express only 2 CDKi at comparable (CDKN1A) or higher (CDKN1B) levels than mature EECs; both loci lack H3K27me3, and CDKN1B alone shows appreciable chromatin access with H3K27ac marking (Figure 6B). Thus, whereas normal EECs express redundant CDKN genes, CDKN2A and CDKN1C silencing might in principle force SI-NET dependence on a limited CDKi repertoire, especially CDKN1B.
To test this hypothesis, we used CRISPR/Cas9 editing to inactivate CDKN1B in parental and ASCL1-null hISCNeurog3 cells (Supplemental Figure 8A). Because multiple defects likely underlie SI-NET pathogenesis and NEUROG3 potently induces cell cycle exit (18), the study was intended not to elicit transformation but to interrogate gene functions in EEC maturation. Following tamoxifen exposure, we assessed cell cycle stages (Supplemental Figure 8B) 48 hours later by flow cytometry of parental (treated with scrambled gRNAs), ASCL1-null, CDKN1B-null, and double mutant cells. NEUROG3 reduced S phase cells in each case, and deletion of CDKN1B alone increased the G2/M phase fraction approximately 3-fold, at the expense of G0/G1 cells (Figure 6C), an effect that was, however, attenuated in double mutant cells. Several transcripts elevated in SI-NETs, e.g., CDK14, CLSTN2, NEGR1, and SOX5, were aberrantly active when ASCL1-null cells differentiate (Supplemental Figure 8C). We asked whether CDKN1B deletion affects these genes or those associated with cell proliferation or EEC maturity. Six days after tamoxifen exposure, when mature EECs dominate the culture, solitary ASCL1 loss affected few progenitor genes > 2-fold. SOX5 mRNA was as markedly elevated in CDKN1B-null as in ASCL1-null cells, and at least 1 gene modestly elevated in ASCL1-null cells — NEGR1 (Neuronal growth regulator 1), which is linked to human obesity and major depressive disorder (42, 43) — was prominently elevated in CDKN1B and double mutant cells (Figure 6D). Thus, like ASCL1 and separate from cell cycle regulation, CDKN1B restrains selected transcripts that are aberrantly active in SI-NETs.


Copyright © 2026 American Society for Clinical Investigation
ISSN: 0021-9738 (print), 1558-8238 (online)