
Advertisement
Research ArticleHepatologyOncology
Open Access |  10.1172/JCI201579
Extracellular matrix reprogramming by the YAP/TAZ/TGF-β2 axis drives immune exclusion in cholangiocarcinoma models
Marco Jessen,1 KyungMok Kim,1 Marie Tollot-Wegner,1 Anita Cindric Vranesic,1 Cagla Dönmez,1 Celina Junker,1 Tina Lehmann,1 Advitiya Khandelwal,1 Yuliya Kurlishchuk,1 Tom Hünniger,1 Christin Ritter,1 Evaristo Di Napoli,2 Shyam Krishnan Murali,1 Konrad Bücking,1 Viktoria Haug,3 Sabine Muth,4 Tracy T. Tang,5 Andreas Rosenwald,3 Markus Radsak,6,7 Donato Inverso,8 Tanja Deckert-Gaudig,9,10 Volker Deckert,9,10 Orlando Paciello,2 and Björn von Eyss1
1Transcriptional Control of Tissue Homeostasis Lab, Leibniz Institute on Aging, Fritz Lipmann Institute e.V. (FLI), Jena, Germany.
2Department of Veterinary Medicine and Animal Production, University of Naples Federico II, Naples, Italy.
3Institute of Pathology, University of Würzburg, Würzburg, Germany.
4Institute of Immunology and Research Center for Immunotherapy (FZI), University Medical Center of the Johannes Gutenberg – University Mainz, Mainz, Germany.
5Vivace Therapeutics Inc., San Mateo, California, USA.
6Department of Hematology and Oncology and Research Center for Immunotherapy (FZI), University Medical Center of the Johannes Gutenberg-University, Mainz, Germany.
7Department of Medicine VII – Hematology and Oncology, Donau-Isar-Klinikum, Deggendorf, Germany.
8Vascular Pathobiology Unit, Vita-Salute San Raffaele University, Milan, Italy.
9Leibniz Institute of Photonic Technology, Jena, Germany.
10Institute of Physical Chemistry and Abbe Center of Photonics, Friedrich-Schiller University Jena, Jena, Germany.
Address correspondence to: Björn von Eyss, Leibniz Institute on Aging – Fritz Lipmann Institute (FLI) e. V., Beutenbergstrasse 11, 07745 Jena, Germany. Phone: 49.0.3641.65.6047; Email: bjoern.voneyss@leibniz-fli.de.
Find articles by
Jessen, M.
in:
PubMed
|
Google Scholar
|

1Transcriptional Control of Tissue Homeostasis Lab, Leibniz Institute on Aging, Fritz Lipmann Institute e.V. (FLI), Jena, Germany.
2Department of Veterinary Medicine and Animal Production, University of Naples Federico II, Naples, Italy.
3Institute of Pathology, University of Würzburg, Würzburg, Germany.
4Institute of Immunology and Research Center for Immunotherapy (FZI), University Medical Center of the Johannes Gutenberg – University Mainz, Mainz, Germany.
5Vivace Therapeutics Inc., San Mateo, California, USA.
6Department of Hematology and Oncology and Research Center for Immunotherapy (FZI), University Medical Center of the Johannes Gutenberg-University, Mainz, Germany.
7Department of Medicine VII – Hematology and Oncology, Donau-Isar-Klinikum, Deggendorf, Germany.
8Vascular Pathobiology Unit, Vita-Salute San Raffaele University, Milan, Italy.
9Leibniz Institute of Photonic Technology, Jena, Germany.
10Institute of Physical Chemistry and Abbe Center of Photonics, Friedrich-Schiller University Jena, Jena, Germany.
Address correspondence to: Björn von Eyss, Leibniz Institute on Aging – Fritz Lipmann Institute (FLI) e. V., Beutenbergstrasse 11, 07745 Jena, Germany. Phone: 49.0.3641.65.6047; Email: bjoern.voneyss@leibniz-fli.de.
Find articles by Kim, K. in: PubMed | Google Scholar
1Transcriptional Control of Tissue Homeostasis Lab, Leibniz Institute on Aging, Fritz Lipmann Institute e.V. (FLI), Jena, Germany.
2Department of Veterinary Medicine and Animal Production, University of Naples Federico II, Naples, Italy.
3Institute of Pathology, University of Würzburg, Würzburg, Germany.
4Institute of Immunology and Research Center for Immunotherapy (FZI), University Medical Center of the Johannes Gutenberg – University Mainz, Mainz, Germany.
5Vivace Therapeutics Inc., San Mateo, California, USA.
6Department of Hematology and Oncology and Research Center for Immunotherapy (FZI), University Medical Center of the Johannes Gutenberg-University, Mainz, Germany.
7Department of Medicine VII – Hematology and Oncology, Donau-Isar-Klinikum, Deggendorf, Germany.
8Vascular Pathobiology Unit, Vita-Salute San Raffaele University, Milan, Italy.
9Leibniz Institute of Photonic Technology, Jena, Germany.
10Institute of Physical Chemistry and Abbe Center of Photonics, Friedrich-Schiller University Jena, Jena, Germany.
Address correspondence to: Björn von Eyss, Leibniz Institute on Aging – Fritz Lipmann Institute (FLI) e. V., Beutenbergstrasse 11, 07745 Jena, Germany. Phone: 49.0.3641.65.6047; Email: bjoern.voneyss@leibniz-fli.de.
Find articles by Tollot-Wegner, M. in: PubMed | Google Scholar
1Transcriptional Control of Tissue Homeostasis Lab, Leibniz Institute on Aging, Fritz Lipmann Institute e.V. (FLI), Jena, Germany.
2Department of Veterinary Medicine and Animal Production, University of Naples Federico II, Naples, Italy.
3Institute of Pathology, University of Würzburg, Würzburg, Germany.
4Institute of Immunology and Research Center for Immunotherapy (FZI), University Medical Center of the Johannes Gutenberg – University Mainz, Mainz, Germany.
5Vivace Therapeutics Inc., San Mateo, California, USA.
6Department of Hematology and Oncology and Research Center for Immunotherapy (FZI), University Medical Center of the Johannes Gutenberg-University, Mainz, Germany.
7Department of Medicine VII – Hematology and Oncology, Donau-Isar-Klinikum, Deggendorf, Germany.
8Vascular Pathobiology Unit, Vita-Salute San Raffaele University, Milan, Italy.
9Leibniz Institute of Photonic Technology, Jena, Germany.
10Institute of Physical Chemistry and Abbe Center of Photonics, Friedrich-Schiller University Jena, Jena, Germany.
Address correspondence to: Björn von Eyss, Leibniz Institute on Aging – Fritz Lipmann Institute (FLI) e. V., Beutenbergstrasse 11, 07745 Jena, Germany. Phone: 49.0.3641.65.6047; Email: bjoern.voneyss@leibniz-fli.de.
Find articles by Cindric Vranesic, A. in: PubMed | Google Scholar
1Transcriptional Control of Tissue Homeostasis Lab, Leibniz Institute on Aging, Fritz Lipmann Institute e.V. (FLI), Jena, Germany.
2Department of Veterinary Medicine and Animal Production, University of Naples Federico II, Naples, Italy.
3Institute of Pathology, University of Würzburg, Würzburg, Germany.
4Institute of Immunology and Research Center for Immunotherapy (FZI), University Medical Center of the Johannes Gutenberg – University Mainz, Mainz, Germany.
5Vivace Therapeutics Inc., San Mateo, California, USA.
6Department of Hematology and Oncology and Research Center for Immunotherapy (FZI), University Medical Center of the Johannes Gutenberg-University, Mainz, Germany.
7Department of Medicine VII – Hematology and Oncology, Donau-Isar-Klinikum, Deggendorf, Germany.
8Vascular Pathobiology Unit, Vita-Salute San Raffaele University, Milan, Italy.
9Leibniz Institute of Photonic Technology, Jena, Germany.
10Institute of Physical Chemistry and Abbe Center of Photonics, Friedrich-Schiller University Jena, Jena, Germany.
Address correspondence to: Björn von Eyss, Leibniz Institute on Aging – Fritz Lipmann Institute (FLI) e. V., Beutenbergstrasse 11, 07745 Jena, Germany. Phone: 49.0.3641.65.6047; Email: bjoern.voneyss@leibniz-fli.de.
Find articles by Dönmez, C. in: PubMed | Google Scholar
1Transcriptional Control of Tissue Homeostasis Lab, Leibniz Institute on Aging, Fritz Lipmann Institute e.V. (FLI), Jena, Germany.
2Department of Veterinary Medicine and Animal Production, University of Naples Federico II, Naples, Italy.
3Institute of Pathology, University of Würzburg, Würzburg, Germany.
4Institute of Immunology and Research Center for Immunotherapy (FZI), University Medical Center of the Johannes Gutenberg – University Mainz, Mainz, Germany.
5Vivace Therapeutics Inc., San Mateo, California, USA.
6Department of Hematology and Oncology and Research Center for Immunotherapy (FZI), University Medical Center of the Johannes Gutenberg-University, Mainz, Germany.
7Department of Medicine VII – Hematology and Oncology, Donau-Isar-Klinikum, Deggendorf, Germany.
8Vascular Pathobiology Unit, Vita-Salute San Raffaele University, Milan, Italy.
9Leibniz Institute of Photonic Technology, Jena, Germany.
10Institute of Physical Chemistry and Abbe Center of Photonics, Friedrich-Schiller University Jena, Jena, Germany.
Address correspondence to: Björn von Eyss, Leibniz Institute on Aging – Fritz Lipmann Institute (FLI) e. V., Beutenbergstrasse 11, 07745 Jena, Germany. Phone: 49.0.3641.65.6047; Email: bjoern.voneyss@leibniz-fli.de.
Find articles by Junker, C. in: PubMed | Google Scholar
1Transcriptional Control of Tissue Homeostasis Lab, Leibniz Institute on Aging, Fritz Lipmann Institute e.V. (FLI), Jena, Germany.
2Department of Veterinary Medicine and Animal Production, University of Naples Federico II, Naples, Italy.
3Institute of Pathology, University of Würzburg, Würzburg, Germany.
4Institute of Immunology and Research Center for Immunotherapy (FZI), University Medical Center of the Johannes Gutenberg – University Mainz, Mainz, Germany.
5Vivace Therapeutics Inc., San Mateo, California, USA.
6Department of Hematology and Oncology and Research Center for Immunotherapy (FZI), University Medical Center of the Johannes Gutenberg-University, Mainz, Germany.
7Department of Medicine VII – Hematology and Oncology, Donau-Isar-Klinikum, Deggendorf, Germany.
8Vascular Pathobiology Unit, Vita-Salute San Raffaele University, Milan, Italy.
9Leibniz Institute of Photonic Technology, Jena, Germany.
10Institute of Physical Chemistry and Abbe Center of Photonics, Friedrich-Schiller University Jena, Jena, Germany.
Address correspondence to: Björn von Eyss, Leibniz Institute on Aging – Fritz Lipmann Institute (FLI) e. V., Beutenbergstrasse 11, 07745 Jena, Germany. Phone: 49.0.3641.65.6047; Email: bjoern.voneyss@leibniz-fli.de.
Find articles by Lehmann, T. in: PubMed | Google Scholar
1Transcriptional Control of Tissue Homeostasis Lab, Leibniz Institute on Aging, Fritz Lipmann Institute e.V. (FLI), Jena, Germany.
2Department of Veterinary Medicine and Animal Production, University of Naples Federico II, Naples, Italy.
3Institute of Pathology, University of Würzburg, Würzburg, Germany.
4Institute of Immunology and Research Center for Immunotherapy (FZI), University Medical Center of the Johannes Gutenberg – University Mainz, Mainz, Germany.
5Vivace Therapeutics Inc., San Mateo, California, USA.
6Department of Hematology and Oncology and Research Center for Immunotherapy (FZI), University Medical Center of the Johannes Gutenberg-University, Mainz, Germany.
7Department of Medicine VII – Hematology and Oncology, Donau-Isar-Klinikum, Deggendorf, Germany.
8Vascular Pathobiology Unit, Vita-Salute San Raffaele University, Milan, Italy.
9Leibniz Institute of Photonic Technology, Jena, Germany.
10Institute of Physical Chemistry and Abbe Center of Photonics, Friedrich-Schiller University Jena, Jena, Germany.
Address correspondence to: Björn von Eyss, Leibniz Institute on Aging – Fritz Lipmann Institute (FLI) e. V., Beutenbergstrasse 11, 07745 Jena, Germany. Phone: 49.0.3641.65.6047; Email: bjoern.voneyss@leibniz-fli.de.
Find articles by Khandelwal, A. in: PubMed | Google Scholar
1Transcriptional Control of Tissue Homeostasis Lab, Leibniz Institute on Aging, Fritz Lipmann Institute e.V. (FLI), Jena, Germany.
2Department of Veterinary Medicine and Animal Production, University of Naples Federico II, Naples, Italy.
3Institute of Pathology, University of Würzburg, Würzburg, Germany.
4Institute of Immunology and Research Center for Immunotherapy (FZI), University Medical Center of the Johannes Gutenberg – University Mainz, Mainz, Germany.
5Vivace Therapeutics Inc., San Mateo, California, USA.
6Department of Hematology and Oncology and Research Center for Immunotherapy (FZI), University Medical Center of the Johannes Gutenberg-University, Mainz, Germany.
7Department of Medicine VII – Hematology and Oncology, Donau-Isar-Klinikum, Deggendorf, Germany.
8Vascular Pathobiology Unit, Vita-Salute San Raffaele University, Milan, Italy.
9Leibniz Institute of Photonic Technology, Jena, Germany.
10Institute of Physical Chemistry and Abbe Center of Photonics, Friedrich-Schiller University Jena, Jena, Germany.
Address correspondence to: Björn von Eyss, Leibniz Institute on Aging – Fritz Lipmann Institute (FLI) e. V., Beutenbergstrasse 11, 07745 Jena, Germany. Phone: 49.0.3641.65.6047; Email: bjoern.voneyss@leibniz-fli.de.
Find articles by Kurlishchuk, Y. in: PubMed | Google Scholar
1Transcriptional Control of Tissue Homeostasis Lab, Leibniz Institute on Aging, Fritz Lipmann Institute e.V. (FLI), Jena, Germany.
2Department of Veterinary Medicine and Animal Production, University of Naples Federico II, Naples, Italy.
3Institute of Pathology, University of Würzburg, Würzburg, Germany.
4Institute of Immunology and Research Center for Immunotherapy (FZI), University Medical Center of the Johannes Gutenberg – University Mainz, Mainz, Germany.
5Vivace Therapeutics Inc., San Mateo, California, USA.
6Department of Hematology and Oncology and Research Center for Immunotherapy (FZI), University Medical Center of the Johannes Gutenberg-University, Mainz, Germany.
7Department of Medicine VII – Hematology and Oncology, Donau-Isar-Klinikum, Deggendorf, Germany.
8Vascular Pathobiology Unit, Vita-Salute San Raffaele University, Milan, Italy.
9Leibniz Institute of Photonic Technology, Jena, Germany.
10Institute of Physical Chemistry and Abbe Center of Photonics, Friedrich-Schiller University Jena, Jena, Germany.
Address correspondence to: Björn von Eyss, Leibniz Institute on Aging – Fritz Lipmann Institute (FLI) e. V., Beutenbergstrasse 11, 07745 Jena, Germany. Phone: 49.0.3641.65.6047; Email: bjoern.voneyss@leibniz-fli.de.
Find articles by Hünniger, T. in: PubMed | Google Scholar
1Transcriptional Control of Tissue Homeostasis Lab, Leibniz Institute on Aging, Fritz Lipmann Institute e.V. (FLI), Jena, Germany.
2Department of Veterinary Medicine and Animal Production, University of Naples Federico II, Naples, Italy.
3Institute of Pathology, University of Würzburg, Würzburg, Germany.
4Institute of Immunology and Research Center for Immunotherapy (FZI), University Medical Center of the Johannes Gutenberg – University Mainz, Mainz, Germany.
5Vivace Therapeutics Inc., San Mateo, California, USA.
6Department of Hematology and Oncology and Research Center for Immunotherapy (FZI), University Medical Center of the Johannes Gutenberg-University, Mainz, Germany.
7Department of Medicine VII – Hematology and Oncology, Donau-Isar-Klinikum, Deggendorf, Germany.
8Vascular Pathobiology Unit, Vita-Salute San Raffaele University, Milan, Italy.
9Leibniz Institute of Photonic Technology, Jena, Germany.
10Institute of Physical Chemistry and Abbe Center of Photonics, Friedrich-Schiller University Jena, Jena, Germany.
Address correspondence to: Björn von Eyss, Leibniz Institute on Aging – Fritz Lipmann Institute (FLI) e. V., Beutenbergstrasse 11, 07745 Jena, Germany. Phone: 49.0.3641.65.6047; Email: bjoern.voneyss@leibniz-fli.de.
Find articles by Ritter, C. in: PubMed | Google Scholar
1Transcriptional Control of Tissue Homeostasis Lab, Leibniz Institute on Aging, Fritz Lipmann Institute e.V. (FLI), Jena, Germany.
2Department of Veterinary Medicine and Animal Production, University of Naples Federico II, Naples, Italy.
3Institute of Pathology, University of Würzburg, Würzburg, Germany.
4Institute of Immunology and Research Center for Immunotherapy (FZI), University Medical Center of the Johannes Gutenberg – University Mainz, Mainz, Germany.
5Vivace Therapeutics Inc., San Mateo, California, USA.
6Department of Hematology and Oncology and Research Center for Immunotherapy (FZI), University Medical Center of the Johannes Gutenberg-University, Mainz, Germany.
7Department of Medicine VII – Hematology and Oncology, Donau-Isar-Klinikum, Deggendorf, Germany.
8Vascular Pathobiology Unit, Vita-Salute San Raffaele University, Milan, Italy.
9Leibniz Institute of Photonic Technology, Jena, Germany.
10Institute of Physical Chemistry and Abbe Center of Photonics, Friedrich-Schiller University Jena, Jena, Germany.
Address correspondence to: Björn von Eyss, Leibniz Institute on Aging – Fritz Lipmann Institute (FLI) e. V., Beutenbergstrasse 11, 07745 Jena, Germany. Phone: 49.0.3641.65.6047; Email: bjoern.voneyss@leibniz-fli.de.
Find articles by Di Napoli, E. in: PubMed | Google Scholar
1Transcriptional Control of Tissue Homeostasis Lab, Leibniz Institute on Aging, Fritz Lipmann Institute e.V. (FLI), Jena, Germany.
2Department of Veterinary Medicine and Animal Production, University of Naples Federico II, Naples, Italy.
3Institute of Pathology, University of Würzburg, Würzburg, Germany.
4Institute of Immunology and Research Center for Immunotherapy (FZI), University Medical Center of the Johannes Gutenberg – University Mainz, Mainz, Germany.
5Vivace Therapeutics Inc., San Mateo, California, USA.
6Department of Hematology and Oncology and Research Center for Immunotherapy (FZI), University Medical Center of the Johannes Gutenberg-University, Mainz, Germany.
7Department of Medicine VII – Hematology and Oncology, Donau-Isar-Klinikum, Deggendorf, Germany.
8Vascular Pathobiology Unit, Vita-Salute San Raffaele University, Milan, Italy.
9Leibniz Institute of Photonic Technology, Jena, Germany.
10Institute of Physical Chemistry and Abbe Center of Photonics, Friedrich-Schiller University Jena, Jena, Germany.
Address correspondence to: Björn von Eyss, Leibniz Institute on Aging – Fritz Lipmann Institute (FLI) e. V., Beutenbergstrasse 11, 07745 Jena, Germany. Phone: 49.0.3641.65.6047; Email: bjoern.voneyss@leibniz-fli.de.
Find articles by Krishnan Murali, S. in: PubMed | Google Scholar
1Transcriptional Control of Tissue Homeostasis Lab, Leibniz Institute on Aging, Fritz Lipmann Institute e.V. (FLI), Jena, Germany.
2Department of Veterinary Medicine and Animal Production, University of Naples Federico II, Naples, Italy.
3Institute of Pathology, University of Würzburg, Würzburg, Germany.
4Institute of Immunology and Research Center for Immunotherapy (FZI), University Medical Center of the Johannes Gutenberg – University Mainz, Mainz, Germany.
5Vivace Therapeutics Inc., San Mateo, California, USA.
6Department of Hematology and Oncology and Research Center for Immunotherapy (FZI), University Medical Center of the Johannes Gutenberg-University, Mainz, Germany.
7Department of Medicine VII – Hematology and Oncology, Donau-Isar-Klinikum, Deggendorf, Germany.
8Vascular Pathobiology Unit, Vita-Salute San Raffaele University, Milan, Italy.
9Leibniz Institute of Photonic Technology, Jena, Germany.
10Institute of Physical Chemistry and Abbe Center of Photonics, Friedrich-Schiller University Jena, Jena, Germany.
Address correspondence to: Björn von Eyss, Leibniz Institute on Aging – Fritz Lipmann Institute (FLI) e. V., Beutenbergstrasse 11, 07745 Jena, Germany. Phone: 49.0.3641.65.6047; Email: bjoern.voneyss@leibniz-fli.de.
Find articles by Bücking, K. in: PubMed | Google Scholar
1Transcriptional Control of Tissue Homeostasis Lab, Leibniz Institute on Aging, Fritz Lipmann Institute e.V. (FLI), Jena, Germany.
2Department of Veterinary Medicine and Animal Production, University of Naples Federico II, Naples, Italy.
3Institute of Pathology, University of Würzburg, Würzburg, Germany.
4Institute of Immunology and Research Center for Immunotherapy (FZI), University Medical Center of the Johannes Gutenberg – University Mainz, Mainz, Germany.
5Vivace Therapeutics Inc., San Mateo, California, USA.
6Department of Hematology and Oncology and Research Center for Immunotherapy (FZI), University Medical Center of the Johannes Gutenberg-University, Mainz, Germany.
7Department of Medicine VII – Hematology and Oncology, Donau-Isar-Klinikum, Deggendorf, Germany.
8Vascular Pathobiology Unit, Vita-Salute San Raffaele University, Milan, Italy.
9Leibniz Institute of Photonic Technology, Jena, Germany.
10Institute of Physical Chemistry and Abbe Center of Photonics, Friedrich-Schiller University Jena, Jena, Germany.
Address correspondence to: Björn von Eyss, Leibniz Institute on Aging – Fritz Lipmann Institute (FLI) e. V., Beutenbergstrasse 11, 07745 Jena, Germany. Phone: 49.0.3641.65.6047; Email: bjoern.voneyss@leibniz-fli.de.
Find articles by Haug, V. in: PubMed | Google Scholar
1Transcriptional Control of Tissue Homeostasis Lab, Leibniz Institute on Aging, Fritz Lipmann Institute e.V. (FLI), Jena, Germany.
2Department of Veterinary Medicine and Animal Production, University of Naples Federico II, Naples, Italy.
3Institute of Pathology, University of Würzburg, Würzburg, Germany.
4Institute of Immunology and Research Center for Immunotherapy (FZI), University Medical Center of the Johannes Gutenberg – University Mainz, Mainz, Germany.
5Vivace Therapeutics Inc., San Mateo, California, USA.
6Department of Hematology and Oncology and Research Center for Immunotherapy (FZI), University Medical Center of the Johannes Gutenberg-University, Mainz, Germany.
7Department of Medicine VII – Hematology and Oncology, Donau-Isar-Klinikum, Deggendorf, Germany.
8Vascular Pathobiology Unit, Vita-Salute San Raffaele University, Milan, Italy.
9Leibniz Institute of Photonic Technology, Jena, Germany.
10Institute of Physical Chemistry and Abbe Center of Photonics, Friedrich-Schiller University Jena, Jena, Germany.
Address correspondence to: Björn von Eyss, Leibniz Institute on Aging – Fritz Lipmann Institute (FLI) e. V., Beutenbergstrasse 11, 07745 Jena, Germany. Phone: 49.0.3641.65.6047; Email: bjoern.voneyss@leibniz-fli.de.
Find articles by Muth, S. in: PubMed | Google Scholar
1Transcriptional Control of Tissue Homeostasis Lab, Leibniz Institute on Aging, Fritz Lipmann Institute e.V. (FLI), Jena, Germany.
2Department of Veterinary Medicine and Animal Production, University of Naples Federico II, Naples, Italy.
3Institute of Pathology, University of Würzburg, Würzburg, Germany.
4Institute of Immunology and Research Center for Immunotherapy (FZI), University Medical Center of the Johannes Gutenberg – University Mainz, Mainz, Germany.
5Vivace Therapeutics Inc., San Mateo, California, USA.
6Department of Hematology and Oncology and Research Center for Immunotherapy (FZI), University Medical Center of the Johannes Gutenberg-University, Mainz, Germany.
7Department of Medicine VII – Hematology and Oncology, Donau-Isar-Klinikum, Deggendorf, Germany.
8Vascular Pathobiology Unit, Vita-Salute San Raffaele University, Milan, Italy.
9Leibniz Institute of Photonic Technology, Jena, Germany.
10Institute of Physical Chemistry and Abbe Center of Photonics, Friedrich-Schiller University Jena, Jena, Germany.
Address correspondence to: Björn von Eyss, Leibniz Institute on Aging – Fritz Lipmann Institute (FLI) e. V., Beutenbergstrasse 11, 07745 Jena, Germany. Phone: 49.0.3641.65.6047; Email: bjoern.voneyss@leibniz-fli.de.
Find articles by Tang, T. in: PubMed | Google Scholar
1Transcriptional Control of Tissue Homeostasis Lab, Leibniz Institute on Aging, Fritz Lipmann Institute e.V. (FLI), Jena, Germany.
2Department of Veterinary Medicine and Animal Production, University of Naples Federico II, Naples, Italy.
3Institute of Pathology, University of Würzburg, Würzburg, Germany.
4Institute of Immunology and Research Center for Immunotherapy (FZI), University Medical Center of the Johannes Gutenberg – University Mainz, Mainz, Germany.
5Vivace Therapeutics Inc., San Mateo, California, USA.
6Department of Hematology and Oncology and Research Center for Immunotherapy (FZI), University Medical Center of the Johannes Gutenberg-University, Mainz, Germany.
7Department of Medicine VII – Hematology and Oncology, Donau-Isar-Klinikum, Deggendorf, Germany.
8Vascular Pathobiology Unit, Vita-Salute San Raffaele University, Milan, Italy.
9Leibniz Institute of Photonic Technology, Jena, Germany.
10Institute of Physical Chemistry and Abbe Center of Photonics, Friedrich-Schiller University Jena, Jena, Germany.
Address correspondence to: Björn von Eyss, Leibniz Institute on Aging – Fritz Lipmann Institute (FLI) e. V., Beutenbergstrasse 11, 07745 Jena, Germany. Phone: 49.0.3641.65.6047; Email: bjoern.voneyss@leibniz-fli.de.
Find articles by Rosenwald, A. in: PubMed | Google Scholar
1Transcriptional Control of Tissue Homeostasis Lab, Leibniz Institute on Aging, Fritz Lipmann Institute e.V. (FLI), Jena, Germany.
2Department of Veterinary Medicine and Animal Production, University of Naples Federico II, Naples, Italy.
3Institute of Pathology, University of Würzburg, Würzburg, Germany.
4Institute of Immunology and Research Center for Immunotherapy (FZI), University Medical Center of the Johannes Gutenberg – University Mainz, Mainz, Germany.
5Vivace Therapeutics Inc., San Mateo, California, USA.
6Department of Hematology and Oncology and Research Center for Immunotherapy (FZI), University Medical Center of the Johannes Gutenberg-University, Mainz, Germany.
7Department of Medicine VII – Hematology and Oncology, Donau-Isar-Klinikum, Deggendorf, Germany.
8Vascular Pathobiology Unit, Vita-Salute San Raffaele University, Milan, Italy.
9Leibniz Institute of Photonic Technology, Jena, Germany.
10Institute of Physical Chemistry and Abbe Center of Photonics, Friedrich-Schiller University Jena, Jena, Germany.
Address correspondence to: Björn von Eyss, Leibniz Institute on Aging – Fritz Lipmann Institute (FLI) e. V., Beutenbergstrasse 11, 07745 Jena, Germany. Phone: 49.0.3641.65.6047; Email: bjoern.voneyss@leibniz-fli.de.
Find articles by Radsak, M. in: PubMed | Google Scholar
1Transcriptional Control of Tissue Homeostasis Lab, Leibniz Institute on Aging, Fritz Lipmann Institute e.V. (FLI), Jena, Germany.
2Department of Veterinary Medicine and Animal Production, University of Naples Federico II, Naples, Italy.
3Institute of Pathology, University of Würzburg, Würzburg, Germany.
4Institute of Immunology and Research Center for Immunotherapy (FZI), University Medical Center of the Johannes Gutenberg – University Mainz, Mainz, Germany.
5Vivace Therapeutics Inc., San Mateo, California, USA.
6Department of Hematology and Oncology and Research Center for Immunotherapy (FZI), University Medical Center of the Johannes Gutenberg-University, Mainz, Germany.
7Department of Medicine VII – Hematology and Oncology, Donau-Isar-Klinikum, Deggendorf, Germany.
8Vascular Pathobiology Unit, Vita-Salute San Raffaele University, Milan, Italy.
9Leibniz Institute of Photonic Technology, Jena, Germany.
10Institute of Physical Chemistry and Abbe Center of Photonics, Friedrich-Schiller University Jena, Jena, Germany.
Address correspondence to: Björn von Eyss, Leibniz Institute on Aging – Fritz Lipmann Institute (FLI) e. V., Beutenbergstrasse 11, 07745 Jena, Germany. Phone: 49.0.3641.65.6047; Email: bjoern.voneyss@leibniz-fli.de.
Find articles by
Inverso, D.
in:
PubMed
|
Google Scholar
|
1Transcriptional Control of Tissue Homeostasis Lab, Leibniz Institute on Aging, Fritz Lipmann Institute e.V. (FLI), Jena, Germany.
2Department of Veterinary Medicine and Animal Production, University of Naples Federico II, Naples, Italy.
3Institute of Pathology, University of Würzburg, Würzburg, Germany.
4Institute of Immunology and Research Center for Immunotherapy (FZI), University Medical Center of the Johannes Gutenberg – University Mainz, Mainz, Germany.
5Vivace Therapeutics Inc., San Mateo, California, USA.
6Department of Hematology and Oncology and Research Center for Immunotherapy (FZI), University Medical Center of the Johannes Gutenberg-University, Mainz, Germany.
7Department of Medicine VII – Hematology and Oncology, Donau-Isar-Klinikum, Deggendorf, Germany.
8Vascular Pathobiology Unit, Vita-Salute San Raffaele University, Milan, Italy.
9Leibniz Institute of Photonic Technology, Jena, Germany.
10Institute of Physical Chemistry and Abbe Center of Photonics, Friedrich-Schiller University Jena, Jena, Germany.
Address correspondence to: Björn von Eyss, Leibniz Institute on Aging – Fritz Lipmann Institute (FLI) e. V., Beutenbergstrasse 11, 07745 Jena, Germany. Phone: 49.0.3641.65.6047; Email: bjoern.voneyss@leibniz-fli.de.
Find articles by Deckert-Gaudig, T. in: PubMed | Google Scholar
1Transcriptional Control of Tissue Homeostasis Lab, Leibniz Institute on Aging, Fritz Lipmann Institute e.V. (FLI), Jena, Germany.
2Department of Veterinary Medicine and Animal Production, University of Naples Federico II, Naples, Italy.
3Institute of Pathology, University of Würzburg, Würzburg, Germany.
4Institute of Immunology and Research Center for Immunotherapy (FZI), University Medical Center of the Johannes Gutenberg – University Mainz, Mainz, Germany.
5Vivace Therapeutics Inc., San Mateo, California, USA.
6Department of Hematology and Oncology and Research Center for Immunotherapy (FZI), University Medical Center of the Johannes Gutenberg-University, Mainz, Germany.
7Department of Medicine VII – Hematology and Oncology, Donau-Isar-Klinikum, Deggendorf, Germany.
8Vascular Pathobiology Unit, Vita-Salute San Raffaele University, Milan, Italy.
9Leibniz Institute of Photonic Technology, Jena, Germany.
10Institute of Physical Chemistry and Abbe Center of Photonics, Friedrich-Schiller University Jena, Jena, Germany.
Address correspondence to: Björn von Eyss, Leibniz Institute on Aging – Fritz Lipmann Institute (FLI) e. V., Beutenbergstrasse 11, 07745 Jena, Germany. Phone: 49.0.3641.65.6047; Email: bjoern.voneyss@leibniz-fli.de.
Find articles by Deckert, V. in: PubMed | Google Scholar
1Transcriptional Control of Tissue Homeostasis Lab, Leibniz Institute on Aging, Fritz Lipmann Institute e.V. (FLI), Jena, Germany.
2Department of Veterinary Medicine and Animal Production, University of Naples Federico II, Naples, Italy.
3Institute of Pathology, University of Würzburg, Würzburg, Germany.
4Institute of Immunology and Research Center for Immunotherapy (FZI), University Medical Center of the Johannes Gutenberg – University Mainz, Mainz, Germany.
5Vivace Therapeutics Inc., San Mateo, California, USA.
6Department of Hematology and Oncology and Research Center for Immunotherapy (FZI), University Medical Center of the Johannes Gutenberg-University, Mainz, Germany.
7Department of Medicine VII – Hematology and Oncology, Donau-Isar-Klinikum, Deggendorf, Germany.
8Vascular Pathobiology Unit, Vita-Salute San Raffaele University, Milan, Italy.
9Leibniz Institute of Photonic Technology, Jena, Germany.
10Institute of Physical Chemistry and Abbe Center of Photonics, Friedrich-Schiller University Jena, Jena, Germany.
Address correspondence to: Björn von Eyss, Leibniz Institute on Aging – Fritz Lipmann Institute (FLI) e. V., Beutenbergstrasse 11, 07745 Jena, Germany. Phone: 49.0.3641.65.6047; Email: bjoern.voneyss@leibniz-fli.de.
Find articles by Paciello, O. in: PubMed | Google Scholar
1Transcriptional Control of Tissue Homeostasis Lab, Leibniz Institute on Aging, Fritz Lipmann Institute e.V. (FLI), Jena, Germany.
2Department of Veterinary Medicine and Animal Production, University of Naples Federico II, Naples, Italy.
3Institute of Pathology, University of Würzburg, Würzburg, Germany.
4Institute of Immunology and Research Center for Immunotherapy (FZI), University Medical Center of the Johannes Gutenberg – University Mainz, Mainz, Germany.
5Vivace Therapeutics Inc., San Mateo, California, USA.
6Department of Hematology and Oncology and Research Center for Immunotherapy (FZI), University Medical Center of the Johannes Gutenberg-University, Mainz, Germany.
7Department of Medicine VII – Hematology and Oncology, Donau-Isar-Klinikum, Deggendorf, Germany.
8Vascular Pathobiology Unit, Vita-Salute San Raffaele University, Milan, Italy.
9Leibniz Institute of Photonic Technology, Jena, Germany.
10Institute of Physical Chemistry and Abbe Center of Photonics, Friedrich-Schiller University Jena, Jena, Germany.
Address correspondence to: Björn von Eyss, Leibniz Institute on Aging – Fritz Lipmann Institute (FLI) e. V., Beutenbergstrasse 11, 07745 Jena, Germany. Phone: 49.0.3641.65.6047; Email: bjoern.voneyss@leibniz-fli.de.
Find articles by von Eyss, B. in: PubMed | Google Scholar
Published July 2, 2026 - More info
J Clin Invest. 2026;136(17):e201579. https://doi.org/10.1172/JCI201579.
© 2026 Jessen et al. This work is licensed under the Creative Commons Attribution 4.0 International License. To view a copy of this license, visit http://creativecommons.org/licenses/by/4.0/.
Received: October 21, 2025; Accepted: June 30, 2026

-
Results
Ubiquitous long-term depletion of YAP/TAZ is highly detrimental. In order to model the efficacy as well as potential adverse side effects of therapies targeting YAP/TAZ, we developed a doxycycline-inducible shRNA mouse model that enables the depletion of YAP/TAZ in the entire body of a mouse (Figure 1A). An shRenilla (shRen) mouse line was used as the nontargeting control as well as 2 shYAP/TAZ (shYT1 and shYT2) mouse lines, each expressing a distinct shRNA targeting Yap and Taz (Wwtr1), respectively. Both shYT lines showed a potent knockdown of YAP and TAZ, achieving an approximately 80%–90% reduction across different tissues (Figure 1B and Supplemental Figure 1, A–E; supplemental material available online with this article; https://doi.org/10.1172/JCI201579DS1). To validate the functionality of the shRNA mouse lines, we analyzed known YAP/TAZ-dependent knockout phenotypes in the shRNA lines: loss of biliary epithelial cells (BECs) and impairment of intestinal regeneration (Figure 1, C–G). Depletion of YAP/TAZ led to a significant reduction of BECs (Figure 1, C and D, and Supplemental Figure 2, A and B) and strongly impaired intestinal regeneration after γ irradiation (Figure 1, E–G). In all our experiments shYT2 led to stronger phenotypes. These analyses thus demonstrate that the shRNA mouse model can recapitulate YAP/TAZ knockout phenotypes. Long-term depletion of YAP/TAZ (as compared with depletion of YAP or TAZ alone), was not well tolerated: most mice had to be sacrificed after 1 month because of excessive body weight loss (Figure 1H and Supplemental Figure 3, A–G). Histological analysis at the humane endpoint revealed that shYT animals had multifocal lesions across multiple organs, including hepatic inflammation, necrosis, and parenchymal degeneration; cardiomyocyte degeneration; and tubular epithelial cell damage in the kidneys (Figure 1I and Supplemental Figure 4, A–C). Thus, ubiquitous long-term YAP/TAZ depletion can lead to multiorgan defects. However, intermittent doxycycline administration could mitigate these adverse effects, enabling long-term experiments and suggesting the existence of a potential therapeutic window for YAP/TAZ inhibition (Figure 1J and Supplemental Figure 3B).
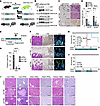 Figure 1
Systemic long-term depletion of YAP/TAZ is highly detrimental. (A) Schematic of the inducible shRNA mouse model. Ubiquitous expression of rtTA3 under the CAG promoter enables ubiquitous expression of doxycycline-inducible shRNAs targeting Yap1 and Wwtr1 (Taz). Two independent mouse lines (shYT1 and shYT2) were compared with control mice expressing an shRNA against Renilla (shRen). (B) Western blot of liver lysates confirming YAP and TAZ knockdown after 2 weeks (shYT2) or 4 weeks (shYT1) of doxycycline treatment (n = 3 per group). (C and D) Liver sections (C) stained for CK19 and Sox9; arrows indicate positive BECs (scale bars: 100 μm) and quantification (D) of BEC counts per liver area (n = 6 per group). (E) Experimental outline: after 7 days of doxycycline-induced (Doxy) knockdown, mice were subjected to 10 Gy irradiation, and intestinal regeneration was assessed 4 days later. (F and G) Intestinal sections (F) analyzed by H&E and YAP IHC, and EdU (green) with DAPI (blue). Enlarged insets highlight Paneth cells (arrows) and quantification (G) of EdU+ crypts (n = 6 per group). Scale bars: 200 μm (overview) and 50 μm (enlarged insets). (H and J) Kaplan-Meier survival curves under constant (H) or intermittent (J) doxycycline administration for 4 weeks. Control group: shRen (n = 17 [H], n = 15 [J]); shY1 (n = 9); shT1, n = 11; shYT1 (n = 6 [H], n = 7 [J]); shYT2 (n = 6 [H], n = 4 [J]). (I) Representative H&E and PAS staining of liver, heart, and kidney sections from mice with the indicated genotypes after long-term depletion of YAP/TAZ. Scale bars: 200 μm. The liver H&E image panel for shYT 1 is also shown in Supplemental Figure 4 as a representative example. Data represent the mean ± SEM. Statistical analyses: 1-way ANOVA with Tukey’s HSD post hoc test (D and G) or ranked test (H).
Transient YAP/TAZ inhibition is beneficial in advanced cholangiocarcinoma. Cholangiocarcinomas (CCAs) are highly aggressive tumors with a poor prognosis for affected patients, and they show a critical dependency on high YAP/TAZ activity (22). We thus tested the applicability of ubiquitous YAP/TAZ inhibition in tumor therapy as a proof of concept in a CCA mouse model. Intermittent YAP/TAZ inhibition was sufficient to render mice tumor free in a hydrodynamic tail vein injection–induced (HDTVI-induced) CCA model utilizing a transposase-based system to express activated versions of the notch receptor (NICD) and myristoylated AKT (myr-AKT) (Figure 2, A–D). Next, we addressed how ubiquitous YAP/TAZ inhibition affects CCA growth in a setting that more closely resembles a clinical setting, in which only 2 weekly pulses of doxycycline were administered in highly advanced tumors (Figure 2E). This regimen was sufficient to nearly double the median survival of shYT animals (Figure 2F). The analysis of tumors from shYT animals that reached the endpoint criteria after the second doxycycline pulse (“late” time point) showed a significant reduction of the liver–to–body weight ratio and tumor load, demonstrating that transient YAP/TAZ inhibition was sufficient to severely reduce the tumor burden in highly advanced CCAs (Figure 2, F–I).
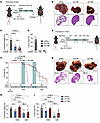 Figure 2
YAP/TAZ inhibition is beneficial in advanced CCA. (A) Preventive model: YAP/TAZ depletion was initiated in the HDTVI N-AKT CCA model via weekly intermittent doxycycline administration. Tumors were analyzed 5 weeks after HDTVI. N, notch intracellular domain. (B) Representative gross liver images (top) and H&E-stained liver sections (bottom) from mice of the indicated genotypes are shown. Scale bars: 1 cm (livers), 2 mm (H&E). (C and D) Quantification (C) of liver-to-body weight ratios and relative tumor area (D) (shRen, n = 8; shYT1, n = 3; shYT2, n = 7). (E) Therapeutic model: YAP/TAZ depletion was transiently performed in advanced N-AKT CCA 4 and 7 weeks after HDTVI. (F) Kaplan-Meier survival curves depict early (weeks 1–7) and late (weeks 8–10) survival of control mice (shRen, n = 12) versus YAP/TAZ-depleted mice (shYT1, n = 10; shYT2, n = 13). (G) Representative livers (top) and H&E-stained liver sections are shown. The respective survival rates (in days) are indicated. Scale bars: 1 cm (livers) and 2 mm (H&E). (H and I) Quantification (I) of liver-to-body weight ratios and relative tumor area (J) (shRen, n = 12; shYT1, n = 10; shYT2, n = 13). Data represent the mean ± SEM. Statistical analyses: 1-way ANOVA with Tukey’s HSD post hoc test (C, D, H, and I) or ranked test (F).
Tumor cell–specific YAP/TAZ depletion recapitulates ubiquitous YAP/TAZ depletion. Next, we aimed to gain mechanistic insight into the early events triggered by YAP/TAZ inhibition in advanced tumors. To this end, we knocked down YAP/TAZ in advanced CCAs and analyzed the acute downstream effects (Figure 3A and Supplemental Figure 5). The mice were fed doxycycline starting from day 25 after HDTVI, and their tumors were analyzed 8 days later.
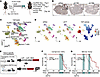 Figure 3
Tumor cell–specific YAP/TAZ depletion recapitulates ubiquitous YAP/TAZ depletion. (A) Acute depletion model: YAP/TAZ depletion was initiated at day 25 after HDTVI and analyzed at day 33 in the N-AKT CCA model. (B) IHC images of YAP staining (brown) in tumor-bearing livers. Arrows in the magnified view mark YAP+ tumor cells. Scale bars: 1 mm (overviews) and 50 μm (enlarged insets). (C and D) UMAP plots from scRNA-seq following acute YAP/TAZ depletion: (C) overview of cell types in the N-AKT CCA model; (D, left) cell composition in shRen and shYT tumors; (D, right) YAP activation scores indicated across all cell types, based on a conserved YAP signature (24) (shRen, n = 4; shYT 1, n = 2; shYT 2, n = 2). pDC, plasmacytoid DC. (E) Schematic of tissue-specific rtTA3 expression (Rosa26-CAG-lsl-RIK). Cre-mediated deletion of the STOP cassette enables tissue-specific shRNA expression in CAFs (Col1a2-Cre) or tumor cells (Cre via plasmid in HDTVI). (F and G) Kaplan-Meier survival curve (log-rank test) for mice with (F) CAF-specific (shRen, n = 13; shYT2, n = 14) or (G) tumor cell–specific (shRen, n = 10; shYT2, n = 13) YAP/TAZ knockdown.
Since it takes approximately 5 days for a knockdown to fully establish in vivo (23), the tumors were depleted of YAP/TAZ for approximately 3 days. Consistently, we found that YAP was barely detectable in shYT CCAs and that Yap1 and Taz mRNAs were strongly downregulated in our RNA-Seq data, coinciding with downregulation of the YAP/TAZ targets (Figure 3B and Supplemental Figure 5B, and Supplemental Table 1). In the scRNA-Seq analyses (shRen: n = 4, shYT1: n = 2, shYT2: n = 2), we could identify the tumor cells on the basis of expression of AKT/NICD and annotate other cell types (Figure 3, C and D, and Supplemental Figure 6A). Using a highly conserved YAP/TAZ signature (24) to assess overall activity, we observed that tumor cells and cancer-associated fibroblasts (CAFs) exhibited the highest YAP/TAZ activity (Figure 3D). These cell types also showed the most pronounced changes in YAP/TAZ target gene expression following YAP/TAZ depletion (Supplemental Figure 6, B and C). Selective YAP/TAZ depletion in either CAFs or tumor cells (Figure 3E), achieved via a Cre-inducible rtTA3 allele, revealed that targeting YAP/TAZ in tumor cells conferred a substantial survival advantage, whereas depletion in CAFs did not have a beneficial effect (Figure 3, F and G).
Acute YAP/TAZ depletion in advanced CCAs leads to T cell infiltration and activation. T and NK cells, which increased approximately 2-fold in shYT tumors, showed the most drastic relative increase of all cells within tumors in shYT animals (Figure 4A and Supplemental Figure 7A). In addition, clusters of intratumoral T cells and CD8+ cytotoxic T cells could only be observed in shYT tumors (Figure 4, B and C). T cells in shRen tumors could only be found sparsely at the tumor margin, indicating that high YAP/TAZ played an active role in T cell exclusion. Differential gene expression analyses of the scRNA-Seq data set within the T cell cluster revealed potent transcriptional responses indicative of T cell activation (Figure 4D), arguing that YAP/TAZ depletion allows (a) T cells to enter the tumor and (b) to become activated within in the tumor. An shYT T cell signature derived from the scRNA-Seq data set was highly predictive in a CCA dataset from TCGA, demonstrating that YAP/TAZ depletion can have a clinically important effect on the activities of intratumoral immune cells (Figure 4E and Supplemental Table 2). An intercellular communication network analysis using CellChat (25) revealed that (a) tumor cells showed enhanced interactions with T and NK cells, and (b) T cells were predicted to increase their engagement with virtually all cell types (Figure 4F and Supplemental Figure 7B). Importantly, and in contrast to findings in other cancer types (26), YAP/TAZ knockdown did not alter Cd274 (programmed cell death ligand 1 [PD-L1]) expression in CCA tumor cells (Supplemental Figure 7C).
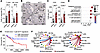 Figure 4
Acute YAP/TAZ depletion in advanced CCA promotes T cell infiltration and activation. (A) Proportion of T cells (left) and NK cells (right), shown as the percentage of total cells detected by scRNA-seq, following acute YAP/TAZ depletion (shRen, n = 4; shYT1, n = 2; shYT2, n = 2). (B and C) CD3 and CD8a immunostaining (B) in CCAs after acute YAP/TAZ depletion, with quantification (C) (shRen, n = 7; shYT1, n = 2; shYT2, n = 5). Arrowheads indicate positive cells. Scale bars: 100 μm. (D) Dot plot showing enriched pathways in YAP/TAZ-depleted T cells. (E) Kaplan-Meier survival curve for patients with CCA (TCGA dataset) stratified by high versus low expression of a YAP/TAZ-dependent T cell activation signature. (F) Circle plots showing the predicted ligand-receptor interactions of tumor cells (left) and T cells (right) with other cell types, inferred by CellChat. Line thickness indicates interaction strength; red and blue lines represent upregulated and downregulated interactions, respectively. MΦ, macrophages. Data represent the mean ± SEM. Statistical analyses: Welch’s t test with Benjamini-Hochberg correction (A and C) and log-rank test (E).
The therapeutic effect of YAP/TAZ depletion depends on CD8+ cytotoxic T cells. To test the contribution of CD8+ cytotoxic T cells to the survival benefit in the therapeutic setting of shYT animals, we immunodepleted CD8+ cytotoxic T cells during the 2 weekly doxycycline pulses (Figure 5A and Supplemental Figure 8). The depletion of CD8+ cytotoxic T cells had no noticeable effect on the shRen control group, indicative of blunted immunosurveillance in the CCA model. In shYT2 animals, however, the depletion of CD8+ T cells significantly decreased the survival advantage, indicating that YAP/TAZ depletion specifically activated CD8+ cytotoxic T cells, contributing to the observed survival benefit (Figure 5, A and B).
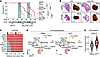 Figure 5
The therapeutic effect of YAP/TAZ depletion depends on CD8+ cytotoxic T cells. (A and B) Kaplan-Meier survival curves for shRen and shYT2 CCA-bearing mice with or without CD8+ T cell depletion (shRen Ctrl, n = 9; shRen anti-CD8, n = 9; shYT2 Ctrl, n = 9; shYT2 anti-CD8, n = 11). Representative livers and H&E-stained liver sections are shown with the respective survival rates (in days). Scale bars: 1 cm (gross images) and 1 mm (H&E). (C) CellChat analysis showing significantly upregulated ligand-receptor interactions upon YAP/TAZ depletion. The x-axis indicates relative information flow, a quantitative measure of overall signaling activity. (D) UMAP plots illustrating reclustering of the T cell compartment from scRNA-seq data (Figure 3). (E) Expression of a T cell exhaustion signature in CD8+ cytotoxic T cells from shRen and shYT2 tumors. Statistical analyses: log-rank test (A) and Wilcoxon-rank test (E). Box plot: center line reflects the median; box limits: Q1 and Q3; whiskers: data points within 1.5 times the IQR.
Further CellChat analyses revealed that the most significantly altered pathways in shYT animals were predominantly immune checkpoint related — such as pathways for PD-L1, PD-L2, and CD276, which became almost exclusively activated in this context (Figure 5C). Subclustering of T cells corroborated the observation that shYT tumors had a strong increase in exhaustion signatures (Figure 5, D and E, and Supplemental Table 3). YAP/TAZ can induce PD-L1 expression on tumors (27, 28). However, the observed survival benefit in YAP/TAZ-depleted mice was most likely not attributable to this mechanism, as PD-L1 expression remained unchanged in both tumor cells and the tumor microenvironment (TME) following YAP/TAZ depletion (Supplemental Figure 9A). A plausible explanation for the increased T cell exhaustion signatures detected by CellChat is that YAP/TAZ depletion enables CD8+ T cells to more efficiently infiltrate the tumor, where they encounter a highly immunosuppressive microenvironment characterized by elevated immunosuppressive cytokines, such as IL-10, and widespread expression of immunosuppressive molecules, including PD-L1, on tumor-associated macrophages and other cell types (Supplemental Figure 9, B and C).
YAP/TAZ depletion sensitizes CCAs toward immune checkpoint inhibitors. These findings suggest that, although YAP/TAZ depletion triggers some level of T cell activation, immune checkpoints continue to restrain their full response, presenting an additional barrier to immune engagement. In the clinic, CCAs respond very poorly to immune checkpoint blockade (ICB) with agents such as anti–programmed death 1 (anti–PD-1) antibodies, which is largely attributed to the desmoplastic nature of CCAs as well as their immunosuppressive TME (29). From our previous analyses, we hypothesized that CD8+ cytotoxic T cells infiltrating the tumor following YAP/TAZ depletion are rapidly suppressed and exhausted due to immune checkpoint activation. On the basis of this hypothesis, we posited that ICB drugs should show a synergistic efficacy with YAP/TAZ depletion. To investigate this, we analyzed the survival of shRen and shYT2 animals that were administered an anti–PD-1 antibody targeting murine PD-1. shRen animals did not show any measurable response to anti–PD-1 treatment, whereas shYT2 animals demonstrated a strong survival benefit with a high percentage of animals having a doubled survival rate and a reduced tumor load (Figure 6, A and B).
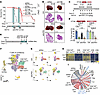 Figure 6
YAP/TAZ depletion sensitizes CCAs toward ICB. (A) Kaplan-Meier survival curves for shRen and shYT2 animals treated with or without anti–PD-1 (shRen control [shRen Ctrl], n = 11; shRen anti–PD-1, n = 10; shYT2 Ctrl, n = 12; shYT2 anti–PD-1, n = 12). (B) Representative livers and H&E-stained liver sections are shown with the respective survival rates (in days). Scale bars: 1 cm (gross images) and 2 mm (H&E). (C) Schematic of combination therapy with high (10 mg/kg) or low (1 mg/kg) doses of VT104 and anti–PD-1 in N-AKT–driven CCA. (D) Tumor burden quantified in each group (n = 5; Ctrl [high-dose VT104], n = 4). (E) Schematic of acute YAP/TAZ depletion combined with anti–PD-1, followed by scRNA-seq analysis. (F and G) UMAP plots showing T cell clusters across all conditions (F) or stratified by treatment groups (G) (n = 4 per group). (H) Heatmap of marker genes used for T cell subtype annotation of Tcf7+ Sell+ T cells. (I) Chord diagram showing the relative abundance of T cell subtypes across treatment groups. The most prominent shifts in T cell populations are highlighted in blue. Data represent the mean ± SEM. Statistical analyses: 1-way ANOVA with Tukey’s HSD post hoc test (D) and log-rank test (A).
These findings could be recapitulated with the TEAD inhibitor VT104 (16): at a high concentration (10 mg/kg), VT104 alone markedly reduced tumor burden, potentially reaching a therapeutic ceiling beyond which additional benefit from anti–PD-1 treatment was not readily detectable. In contrast, at a lower VT104 concentration (1 mg/kg), anti–PD-1 treatment strongly synergized with VT104 to reduce tumor burden. (Figure 6, C and D, and Supplemental Figure 10). To understand how YAP/TAZ depletion sensitizes tumors to ICB, we performed scRNA-Seq after YAP/TAZ depletion in combination with anti–PD-1 (Figure 6E). As expected, anti–PD-1 led to a major shift in the T cell populations (Figure 6, F and G). Within the T cell population, we identified distinct subfractions of CD8+ cytotoxic T cells exhibiting a progressive increase in exhaustion signatures (Supplemental Figure 11 and Supplemental Tables 3 and 4), transitioning from CD8 effector (eff) to CD8 exhausted intermediate (ex int), and ultimately to fully exhausted (ex) CD8+ T cells. Tumors in shYT animals treated with anti–PD-1 antibodies exhibited a marked increase in CD8 memory-like CD8+Tcf7+Sell+Ccr7hi cells (Tcf7, T cell factor 7; Sell, selectin L/CD62L; Ccr7, C-C motif chemokine receptor 7) and a lower fraction of CD8 ex cells compared with shRen animals that also received anti–PD-1 therapy (Figure 6, G–I). The fraction of intratumoral CD8 memory-like cells is a strong predictor for an efficient response to ICB (30), arguing that YAP/TAZ facilitates the ICB response via this critical fraction of immune cells.
YAP/TAZ drive remodeling of the extracellular matrix. Given our findings, it is evident that TEAD-YAP/TAZ drive a transcriptional program that helps CCAs to grow aggressively and to escape immunosurveillance, e.g., by driving T cell exclusion. By comparing transcriptional profiles of tumor cells with their nonmalignant counterparts — BECs and hepatocytes — we found that YAP/TAZ activated a tumor-specific transcriptional program that was absent in nonmalignant cells (Supplemental Figure 12A and Supplemental Table 5). To identify the primary drivers of this oncogenic TEAD-YAP/TAZ program, we performed CUT&RUN analysis for TEAD1 and YAP in EpCAM-enriched tumor cells (Supplemental Figure 12, B and C). These data were integrated with bulk RNA-seq and ATAC-seq datasets generated from the same purified cells (Figure 7A). TEAD1 CUT&RUN experiments revealed 3,390 high-confidence peaks (q < 1 × 10⁻⁴) that were strongly enriched for TEAD motifs (Supplemental Figure 12B). Since TEAD proteins preferentially bind to enhancer regions (31), directly linking peaks to gene regulation is challenging. To address this, we used the ATAC-Seq data from acutely depleted CCA tumors to assess chromatin accessibility and validate the functional relevance of TEAD1 binding sites (Supplemental Figure 5, C–E).
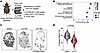 Figure 7
YAP/TAZ drive an extracellular matrix remodeling program. (A) Schematic outlining the identification of direct YAP/TAZ target genes in CCA cells. (B) Dot plot for pathway enrichment analysis, highlighting immune activation and extracellular matrix organization pathways upregulated upon acute YAP/TAZ depletion. (C and D) Representative Weka-segmented images (C) of Picrosirius red–stained liver sections, highlighting collagen fibers (black) and background tissue (white) in tumors with acute YAP/TAZ depletion (shYT1, n = 2; shYT2, n = 5) or control tissue (shRen, n = 6) and quantification (D) of collagen content. Statistical analyses: Welch’s t test with Benjamini-Hochberg correction (D). Scale bars: 1 mm.
Notably, TEAD motifs were highly enriched in regions that became less accessible following YAP/TAZ depletion (Supplemental Figure 5E). On the basis of the cumulative distribution frequency (CDF) of TEAD1 peaks, we inferred that genes located within 107 bp of a TEAD1 peak likely represent the majority of direct targets (Supplemental Figure 12C). In the bulk RNA-Seq dataset of purified tumor cells, gene ontology (GO) terms associated with tissue remodeling were significantly enriched among the downregulated genes, which was accompanied by a marked reduction in intratumoral collagen and loss of the desmoplastic nature (Figure 7, B–D, and Supplemental Figure 5, F and G). Since YAP/TAZ activity is closely linked to mechanotransduction (32), we assessed tissue elasticity (Young’s modulus) using an atomic force microscope (AFM) by measuring force-distance curves on the sectioned tissues. The differences in the Young’s modulus between normal, shRen, and shYT tissues indicated a decrease in tissue elasticity. Unexpectedly, YAP/TAZ depletion resulted in a mild increase in tissue stiffness (Supplemental Figure 5H).
Tgfb2 is a critical target of the oncogenic program driven by YAP/TAZ. These findings suggested that YAP/TAZ regulate a critical set of direct targets involved in tissue remodeling, ultimately contributing to T cell exclusion. Therefore, we compiled a list of 144 direct TEAD1 targets that are responsive to YAP/TAZ depletion (Supplemental Figure 12D and Supplemental Table 6). Further filtering using GO terms for “enzymatic activity” and “extracellular” identified 70 potentially druggable candidates from which we selected 8 known to be involved in T cell exclusion (Figure 8A). These genes were knocked out after HDTVI in vivo, using a doxycycline-inducible Cas9 mouse line (iCas9) (Figure 8B). The most prominent hit was Tgfb2, as its knockout was as effective as targeting the primary oncogenic driver myr-AKT (Figure 8, C and D, and Supplemental Figure 13, B–E). To analyze which cell types contribute to Tgfb2 expression in CCA, we analyzed Tgfb2 expression in our scRNA-seq dataset. We found that Tgfb2 was almost exclusively expressed in tumor cells, indicating that these were the only source of Tgfb2 in CCA (Supplemental Figure 14A). Upon acute YAP/TAZ depletion, Tgfb2 expression was markedly reduced within the tumor cell cluster, supporting the notion that Tgfb2 is a bona fide downstream target of YAP/TAZ (Supplemental Figure 14B). Of note, TGFB2 expression was significantly elevated in samples from patients with CCA compared with expression in normal liver tissue, indicating tumor-associated upregulation (Supplemental Figure 14C), and TGFB2 expression shows a strong positive correlation with a conserved YAP transcriptional signature (24) across 32 cancer types within the Pan-Cancer Atlas, highlighting TGFB2 as a conserved YAP target gene across diverse malignancies (Supplemental Figure 14, D and E).
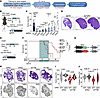 Figure 8
Tgfb2 is a critical target of the oncogenic program driven by YAP/TAZ. (A) Schematic overview of the filtering pipeline used to define YAP/TAZ targets for the in vivo CRISPR screen. (B) Schematic of an inducible Cas9 mouse model combined with HDTVI of sgRNA-expressing plasmids to evaluate the functional role of candidate YAP/TAZ targets in N-AKT–driven CCA growth. (C and D) Representative H&E-stained sections (D) of the indicated gene knockouts with quantification (C) of the tumor area. Scale bars: 1 mm. (n = 5, per group; n = 4, sgIl34 no. 1, no. 2; n = 9, sgCtrl). (E) Schematic of the Tgfb2 knockout in advanced CCA tumors. (F) Kaplan-Meier survival curves for sgCtrl and sgTgfb2 animals treated with or without doxycycline-supplemented food (Normal) (sgCtrl Normal, n = 6; sgCtrl Doxy, n = 10; sgTgfb2 Normal, n = 8; sg Tgfb2 Doxy, n = 10). (G) Schematic of the constructs used in H–J. (H–J) Representative images of H&E-stained (top) and Picrosirius red–stained (bottom) liver sections. Weka segmentation was used to highlight collagen fibers (black). Tumors were subjected to acute YAP/TAZ depletion for 8 days doxycycline administration. TGFB2 was reexpressed in these tumors, while GFP expression served as a control (shRen GFP, n = 5; shRen TGFB2, n = 5; shYT2 GFP, n = 8; shYT2 TGFB2, n = 5). Tumor area (I) and collagen content (J) were quantified. Scale bars: 1 mm. Data represent the mean ± SEM. Box plots show the median (center line), IQR (box), and whiskers extending to 1.5 times the IQR. Data points beyond this range are shown as outliers. Statistical analyses: 1-way ANOVA with Tukey’s HSD post hoc test (C and J); log-rank test (F); and Kruskal-Wallis test followed by Dunn’s post hoc test with Benjamini-Hochberg correction (I).
Since Tgfb2 emerged as the top hit in our in vivo CRISPR screen using a preventive model, we next investigated whether acute Tgfb2 knockout could also confer therapeutic benefit in the context of established tumors, analogous to YAP/TAZ depletion. To this end, Cas9 expression was induced at day 18 after HDTVI, and mouse survival was monitored (Figure 8, E and F). Here, we observed that acute Tgfb2 deletion could substantially extend the survival of the animals (Figure 8F), which resembled the tumor-specific depletion of YAP/TAZ (Figure 4G). Next, we sought to determine whether exogenous Tgfb2 expression could restore oncogenicity in YAP/TAZ-depleted animals (Figure 8G). In support of the notion that Tgfb2 is a critical downstream target of the YAP/TAZ oncogenic program, exogenous TGF-β2 expression in acutely YAP/TAZ-depleted tumors was sufficient to rescue tumor growth to levels comparable to those in shRen control tumors expressing GFP as well as the desmoplastic nature of these tumors (Figure 8, H–J).
YAP/TAZ drive Tgfb2 expression from a distant enhancer. On the basis of our ATAC-Seq and CUT&RUN data (Figure 9A), we could identify 1 putative enhancer region that was located approximately 140 kb downstream of the Tgfb2 transcriptional start site (TSS). In order to have a system that is compatible with more acute YAP/TAZ depletion, we generated tumor organoids from mouse CCAs (Figure 9, B and C). VT104 treatment for 24 hours substantially reduced the mRNA expression of Tgfb2 and the well-established YAP/TAZ target gene Amotl2 (Figure 9D). To assess the acute transcriptional effect of VT104, we additionally measured effects on the pre-mRNA of Tgfb2 and Amotl2 (Figure 9E), using primer pairs spanning exon-intron boundaries, while mature mRNA levels were simultaneously assessed using exon-spanning primers. Tgfb2 pre-mRNA was already potently reduced after 1 hour of VT104 treatment, a regulation that was even faster than that of Amotl2 (Figure 9E). To test whether the putative Tgfb2 enhancer physically contacts the Tgfb2 promoter, we performed chromosome conformation capture (3C) analyses, probing 3 downstream sites using specific primers (3C1, 3C2, 3C3), together with an anchor oligonucleotide positioned at the Tgfb2 TSS (Figure 9A). Primer 3C1 — located directly within the putative enhancer region — yielded a positive PCR signal, whereas 3C2 and 3C3 produced no detectable band (Figure 9F). The absence of signal with 3C2 and 3C3 was not attributable to poor primer performance, as these primers could amplify synthetic oligonucleotide templates with efficiency comparable to that of 3C1. Finally, we tested whether a 307 bp fragment of the putative Tgfb2 enhancer could transactivate a reporter driven by a minimal CMV promoter (Figure 9G). Expression of a constitutively active YAP5SA mutant induced reporter activity up to approximately 300-fold, while a control reporter lacking the enhancer fragment was completely unresponsive (Figure 9G). Collectively, these findings establish Tgfb2 as a direct transcriptional target of YAP/TAZ, regulated through a distal enhancer element located approximately 140 kb downstream of the Tgfb2 TSS. Functionally, acute Tgfb2 deletion phenocopied YAP/TAZ depletion in vivo, and restoring TGFB2 expression in YAP/TAZ-depleted tumors was sufficient to rescue tumor growth, firmly positioning TGF-β2 as a critical effector of the YAP/TAZ oncogenic program in CCA.
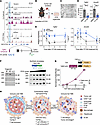 Figure 9
YAP/TAZ drive Tgfb2 expression from a distant enhancer. (A) Genome browser tracks at the Tgfb2 locus showing CUT&RUN profiles for TEAD1, YAP1, H3K4me1, H3K27ac, and IgG, together with ATAC-seq data, in control (shRen) and YAP/TAZ-depleted (shYT2) tumor cells. “Diff ATAC” indicates differential ATAC-seq peaks that are reduced in shYT2 tumor cells. To assess enhancer-promoter interactions at the Tgfb2 locus, 3C primers (nos. 1–3) were used in combination with an anchor primer located at the promoter. (B) Schematic illustrating the isolation of organoids from CCA-bearing livers. (C) Representative bright-field image of CCA organoids. Scale bar: 200 μm. (D) Bar plot showing relative expression of Tgfb2 and Amotl2 in CCA organoids following 24 hours of treatment with the TEAD inhibitor VT104 (DMSO, n = 4; VT104, n = 4). (E) Relative expression of Tgfb2 and Amotl2 mRNA and pre-mRNA at 0, 0.5, 1, 2, and 4 hours after VT104 treatment (DMSO, n = 4; VT104, n = 4). (F) Chromosome conformation capture (3C) assay demonstrating interaction between the promoter anchor site and the 3C #1 region (left). Synthetic DNA templates were used as positive controls to validate primer specificity (right). (G) Luciferase reporter assay showing YAP-dependent activity of the Tgfb2 enhancer (Tgfb2 enh) compared to a control construct (Ctrl) containing only a minimal CMV promoter. Renilla luciferase signal was used for normalization (n = 3). (H) Proposed 2-hit model for the synergy between YAP/TAZ depletion and immune checkpoint blockade (ICB): YAP/TAZ depletion remodels the extracellular matrix, facilitating T cell infiltration and promoting T cell exhaustion. ICB reverses this exhausted state, thereby rendering the CCA TME responsive to immunotherapy. Data represent the mean ± SEM. Statistical analyses: paired Welch’s t test with Benjamini-Hochberg correction (D), 2-way ANOVA (E and G).


Copyright © 2026 American Society for Clinical Investigation
ISSN: 0021-9738 (print), 1558-8238 (online)