
Advertisement
Research ArticleCell biologyOncology
Open Access |  10.1172/JCI200391
Targeting tryptophan hydroxylase 1 restricts growth and suppresses plasticity in neuroendocrine prostate cancer
Jing Wei,1 Jing Wang,1 Jingrui Chen,1 Michelle Zhang,2 Chia-Hui Chen,1 Tianjie Pu,1 Alivia O’Brien,1 Sephtis Hargrove,3 Eva Corey,4 Tzu-Ping Lin,5,6 Allen C. Gao,7 and Boyang Jason Wu1
1Department of Pharmaceutical Sciences, College of Pharmacy and Pharmaceutical Sciences, Washington State University, Spokane, Washington, USA.
2Leigh High School, San Jose, California, USA.
3Summer Undergraduate Research Fellowship Program, College of Pharmacy and Pharmaceutical Sciences, Washington State University, Spokane, Washington, USA.
4Department of Urology, University of Washington, Seattle, Washington, USA.
5Department of Surgery, Kaohsiung Veterans General Hospital, Kaohsiung, Taiwan, China.
6Department of Urology, School of Medicine and Shu-Tien Urological Research Center, National Yang Ming Chiao Tung University, Taipei, Taiwan, China.
7Department of Urologic Surgery, University of California, Davis, Sacramento, California, USA.
Address for correspondence. Boyang Jason Wu, Washington State University, 205 E. Spokane Falls Blvd., PBS 421, Spokane, Washington 99202, USA. Phone: 509.368.6700 ext 88054; Email: boyang.wu@wsu.edu.
Find articles by Wei, J. in: PubMed | Google Scholar
1Department of Pharmaceutical Sciences, College of Pharmacy and Pharmaceutical Sciences, Washington State University, Spokane, Washington, USA.
2Leigh High School, San Jose, California, USA.
3Summer Undergraduate Research Fellowship Program, College of Pharmacy and Pharmaceutical Sciences, Washington State University, Spokane, Washington, USA.
4Department of Urology, University of Washington, Seattle, Washington, USA.
5Department of Surgery, Kaohsiung Veterans General Hospital, Kaohsiung, Taiwan, China.
6Department of Urology, School of Medicine and Shu-Tien Urological Research Center, National Yang Ming Chiao Tung University, Taipei, Taiwan, China.
7Department of Urologic Surgery, University of California, Davis, Sacramento, California, USA.
Address for correspondence. Boyang Jason Wu, Washington State University, 205 E. Spokane Falls Blvd., PBS 421, Spokane, Washington 99202, USA. Phone: 509.368.6700 ext 88054; Email: boyang.wu@wsu.edu.
Find articles by Wang, J. in: PubMed | Google Scholar
1Department of Pharmaceutical Sciences, College of Pharmacy and Pharmaceutical Sciences, Washington State University, Spokane, Washington, USA.
2Leigh High School, San Jose, California, USA.
3Summer Undergraduate Research Fellowship Program, College of Pharmacy and Pharmaceutical Sciences, Washington State University, Spokane, Washington, USA.
4Department of Urology, University of Washington, Seattle, Washington, USA.
5Department of Surgery, Kaohsiung Veterans General Hospital, Kaohsiung, Taiwan, China.
6Department of Urology, School of Medicine and Shu-Tien Urological Research Center, National Yang Ming Chiao Tung University, Taipei, Taiwan, China.
7Department of Urologic Surgery, University of California, Davis, Sacramento, California, USA.
Address for correspondence. Boyang Jason Wu, Washington State University, 205 E. Spokane Falls Blvd., PBS 421, Spokane, Washington 99202, USA. Phone: 509.368.6700 ext 88054; Email: boyang.wu@wsu.edu.
Find articles by Chen, J. in: PubMed | Google Scholar
1Department of Pharmaceutical Sciences, College of Pharmacy and Pharmaceutical Sciences, Washington State University, Spokane, Washington, USA.
2Leigh High School, San Jose, California, USA.
3Summer Undergraduate Research Fellowship Program, College of Pharmacy and Pharmaceutical Sciences, Washington State University, Spokane, Washington, USA.
4Department of Urology, University of Washington, Seattle, Washington, USA.
5Department of Surgery, Kaohsiung Veterans General Hospital, Kaohsiung, Taiwan, China.
6Department of Urology, School of Medicine and Shu-Tien Urological Research Center, National Yang Ming Chiao Tung University, Taipei, Taiwan, China.
7Department of Urologic Surgery, University of California, Davis, Sacramento, California, USA.
Address for correspondence. Boyang Jason Wu, Washington State University, 205 E. Spokane Falls Blvd., PBS 421, Spokane, Washington 99202, USA. Phone: 509.368.6700 ext 88054; Email: boyang.wu@wsu.edu.
Find articles by Zhang, M. in: PubMed | Google Scholar
1Department of Pharmaceutical Sciences, College of Pharmacy and Pharmaceutical Sciences, Washington State University, Spokane, Washington, USA.
2Leigh High School, San Jose, California, USA.
3Summer Undergraduate Research Fellowship Program, College of Pharmacy and Pharmaceutical Sciences, Washington State University, Spokane, Washington, USA.
4Department of Urology, University of Washington, Seattle, Washington, USA.
5Department of Surgery, Kaohsiung Veterans General Hospital, Kaohsiung, Taiwan, China.
6Department of Urology, School of Medicine and Shu-Tien Urological Research Center, National Yang Ming Chiao Tung University, Taipei, Taiwan, China.
7Department of Urologic Surgery, University of California, Davis, Sacramento, California, USA.
Address for correspondence. Boyang Jason Wu, Washington State University, 205 E. Spokane Falls Blvd., PBS 421, Spokane, Washington 99202, USA. Phone: 509.368.6700 ext 88054; Email: boyang.wu@wsu.edu.
Find articles by Chen, C. in: PubMed | Google Scholar
1Department of Pharmaceutical Sciences, College of Pharmacy and Pharmaceutical Sciences, Washington State University, Spokane, Washington, USA.
2Leigh High School, San Jose, California, USA.
3Summer Undergraduate Research Fellowship Program, College of Pharmacy and Pharmaceutical Sciences, Washington State University, Spokane, Washington, USA.
4Department of Urology, University of Washington, Seattle, Washington, USA.
5Department of Surgery, Kaohsiung Veterans General Hospital, Kaohsiung, Taiwan, China.
6Department of Urology, School of Medicine and Shu-Tien Urological Research Center, National Yang Ming Chiao Tung University, Taipei, Taiwan, China.
7Department of Urologic Surgery, University of California, Davis, Sacramento, California, USA.
Address for correspondence. Boyang Jason Wu, Washington State University, 205 E. Spokane Falls Blvd., PBS 421, Spokane, Washington 99202, USA. Phone: 509.368.6700 ext 88054; Email: boyang.wu@wsu.edu.
Find articles by Pu, T. in: PubMed | Google Scholar
1Department of Pharmaceutical Sciences, College of Pharmacy and Pharmaceutical Sciences, Washington State University, Spokane, Washington, USA.
2Leigh High School, San Jose, California, USA.
3Summer Undergraduate Research Fellowship Program, College of Pharmacy and Pharmaceutical Sciences, Washington State University, Spokane, Washington, USA.
4Department of Urology, University of Washington, Seattle, Washington, USA.
5Department of Surgery, Kaohsiung Veterans General Hospital, Kaohsiung, Taiwan, China.
6Department of Urology, School of Medicine and Shu-Tien Urological Research Center, National Yang Ming Chiao Tung University, Taipei, Taiwan, China.
7Department of Urologic Surgery, University of California, Davis, Sacramento, California, USA.
Address for correspondence. Boyang Jason Wu, Washington State University, 205 E. Spokane Falls Blvd., PBS 421, Spokane, Washington 99202, USA. Phone: 509.368.6700 ext 88054; Email: boyang.wu@wsu.edu.
Find articles by O’Brien, A. in: PubMed | Google Scholar
1Department of Pharmaceutical Sciences, College of Pharmacy and Pharmaceutical Sciences, Washington State University, Spokane, Washington, USA.
2Leigh High School, San Jose, California, USA.
3Summer Undergraduate Research Fellowship Program, College of Pharmacy and Pharmaceutical Sciences, Washington State University, Spokane, Washington, USA.
4Department of Urology, University of Washington, Seattle, Washington, USA.
5Department of Surgery, Kaohsiung Veterans General Hospital, Kaohsiung, Taiwan, China.
6Department of Urology, School of Medicine and Shu-Tien Urological Research Center, National Yang Ming Chiao Tung University, Taipei, Taiwan, China.
7Department of Urologic Surgery, University of California, Davis, Sacramento, California, USA.
Address for correspondence. Boyang Jason Wu, Washington State University, 205 E. Spokane Falls Blvd., PBS 421, Spokane, Washington 99202, USA. Phone: 509.368.6700 ext 88054; Email: boyang.wu@wsu.edu.
Find articles by Hargrove, S. in: PubMed | Google Scholar
1Department of Pharmaceutical Sciences, College of Pharmacy and Pharmaceutical Sciences, Washington State University, Spokane, Washington, USA.
2Leigh High School, San Jose, California, USA.
3Summer Undergraduate Research Fellowship Program, College of Pharmacy and Pharmaceutical Sciences, Washington State University, Spokane, Washington, USA.
4Department of Urology, University of Washington, Seattle, Washington, USA.
5Department of Surgery, Kaohsiung Veterans General Hospital, Kaohsiung, Taiwan, China.
6Department of Urology, School of Medicine and Shu-Tien Urological Research Center, National Yang Ming Chiao Tung University, Taipei, Taiwan, China.
7Department of Urologic Surgery, University of California, Davis, Sacramento, California, USA.
Address for correspondence. Boyang Jason Wu, Washington State University, 205 E. Spokane Falls Blvd., PBS 421, Spokane, Washington 99202, USA. Phone: 509.368.6700 ext 88054; Email: boyang.wu@wsu.edu.
Find articles by
Corey, E.
in:
PubMed
|
Google Scholar
|

1Department of Pharmaceutical Sciences, College of Pharmacy and Pharmaceutical Sciences, Washington State University, Spokane, Washington, USA.
2Leigh High School, San Jose, California, USA.
3Summer Undergraduate Research Fellowship Program, College of Pharmacy and Pharmaceutical Sciences, Washington State University, Spokane, Washington, USA.
4Department of Urology, University of Washington, Seattle, Washington, USA.
5Department of Surgery, Kaohsiung Veterans General Hospital, Kaohsiung, Taiwan, China.
6Department of Urology, School of Medicine and Shu-Tien Urological Research Center, National Yang Ming Chiao Tung University, Taipei, Taiwan, China.
7Department of Urologic Surgery, University of California, Davis, Sacramento, California, USA.
Address for correspondence. Boyang Jason Wu, Washington State University, 205 E. Spokane Falls Blvd., PBS 421, Spokane, Washington 99202, USA. Phone: 509.368.6700 ext 88054; Email: boyang.wu@wsu.edu.
Find articles by Lin, T. in: PubMed | Google Scholar
1Department of Pharmaceutical Sciences, College of Pharmacy and Pharmaceutical Sciences, Washington State University, Spokane, Washington, USA.
2Leigh High School, San Jose, California, USA.
3Summer Undergraduate Research Fellowship Program, College of Pharmacy and Pharmaceutical Sciences, Washington State University, Spokane, Washington, USA.
4Department of Urology, University of Washington, Seattle, Washington, USA.
5Department of Surgery, Kaohsiung Veterans General Hospital, Kaohsiung, Taiwan, China.
6Department of Urology, School of Medicine and Shu-Tien Urological Research Center, National Yang Ming Chiao Tung University, Taipei, Taiwan, China.
7Department of Urologic Surgery, University of California, Davis, Sacramento, California, USA.
Address for correspondence. Boyang Jason Wu, Washington State University, 205 E. Spokane Falls Blvd., PBS 421, Spokane, Washington 99202, USA. Phone: 509.368.6700 ext 88054; Email: boyang.wu@wsu.edu.
Find articles by Gao, A. in: PubMed | Google Scholar
1Department of Pharmaceutical Sciences, College of Pharmacy and Pharmaceutical Sciences, Washington State University, Spokane, Washington, USA.
2Leigh High School, San Jose, California, USA.
3Summer Undergraduate Research Fellowship Program, College of Pharmacy and Pharmaceutical Sciences, Washington State University, Spokane, Washington, USA.
4Department of Urology, University of Washington, Seattle, Washington, USA.
5Department of Surgery, Kaohsiung Veterans General Hospital, Kaohsiung, Taiwan, China.
6Department of Urology, School of Medicine and Shu-Tien Urological Research Center, National Yang Ming Chiao Tung University, Taipei, Taiwan, China.
7Department of Urologic Surgery, University of California, Davis, Sacramento, California, USA.
Address for correspondence. Boyang Jason Wu, Washington State University, 205 E. Spokane Falls Blvd., PBS 421, Spokane, Washington 99202, USA. Phone: 509.368.6700 ext 88054; Email: boyang.wu@wsu.edu.
Find articles by Wu, B. in: PubMed | Google Scholar
Published September 17, 2026 - More info
J Clin Invest. 2026;136(22):e200391. https://doi.org/10.1172/JCI200391.
© 2026 Wei et al. This work is licensed under the Creative Commons Attribution 4.0 International License. To view a copy of this license, visit http://creativecommons.org/licenses/by/4.0/.
Received: September 30, 2025; Accepted: September 15, 2026

Related article:
Abstract
Advanced prostate cancer frequently escapes androgen receptor pathway inhibition through mechanisms including restored androgen signaling, lineage plasticity, and metabolic adaptation. Neuroendocrine prostate cancer (NEPC) can emerge as an androgen-insensitive lineage and has mostly been studied in the context of its transcriptional and epigenetic reprogramming. However, evidence increasingly supports the requirement for metabolic rewiring across a variety of pathways in the transition to NEPC. In this issue of the JCI, Wei et al. demonstrated that serotonin metabolism regulated by tryptophan hydroxylase 1 (TPH1) stabilizes the plastic state of NEPC by supporting serotonin-based posttranslational modification (serotonylation) of mTOR and FOXM1/E2F1 activation. These findings position TPH1 as both a neuroendocrine marker and a functional mediator of hormone therapy resistance. Because metabolic escape can involve many pathways, biomarker-guided patient selection will be required for translating these findings to an intervention. Accordingly, targeting TPH1 may delay or reverse therapy-induced NEPC in selected patients.
Authors
Kevin Holm, Neil A. Bhowmick

-
Results
TPH1 is upregulated in NEPC. To clarify TPH1’s clinical relevance to NEPC, we examined TPH1 protein expression in human PC tissues. Immunohistochemistry (IHC) revealed higher TPH1 expression in CRPC than in hormone-sensitive PC (HSPC) and normal prostatic glands, with further elevation in CRPC with NE histology (CRPC-NE) compared with the adenocarcinoma counterpart (CRPC-Adeno), where NE differentiation was predefined by positive synaptophysin (SYP) staining (Figure 1A). Within the same CRPC-NE samples, TPH1 protein levels were higher in SYP+ NE-differentiated areas compared with SYP– adenocarcinoma foci (Figure 1B). We also demonstrated a positive correlation between TPH1 and the additional NE marker CD56 in these CRPC-NE samples using multiplex immunofluorescence (IF) staining (Supplemental Figure 1A; supplemental material available online with this article; https://doi.org/10.1172/JCI200391DS1). We also observed increased TPH1 protein levels in CRPC and NEPC compared with HSPC, with NEPC exhibiting greater TPH1 levels than CRPC in a LuCaP PC patient-derived xenograft (PDX) tissue microarray (TMA) (14) (Supplemental Figure 1B). Examining clinical datasets, we found increased TPH1 mRNA levels in NEPC compared with CRPC-Adeno across 3 datasets and in NE+ cases compared with others within a dataset categorized by AR and NE activity (Figure 1C). Additionally, TPH1 showed a positive coexpression correlation with the NE marker CHGA across multiple cohorts (Supplemental Figure 1C). We further demonstrated a downregulated androgen-responsive gene set and a strong correlation of genes differentially expressed in human NEPC in TPH1-high versus -low tumors in the Beltran cohort (15) (Figure 1D). These data underscore TPH1’s clinical relevance to NEPC.
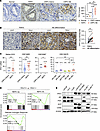 Figure 1
TPH1 is highly expressed in human NEPC. (A) Representative images and quantification of TPH1 IHC staining in normal prostates (n = 14), HSPC (n = 64), CRPC-Adeno (n = 20), and CRPC-NE (n = 17). Scale bar: 50 μm. (B) Representative TPH1 IHC staining and quantification in SYP+ NE-differentiated versus SYP-Adeno areas of the same CRPC-NE samples (n = 17) in A. Scale bar: 50 μm. (C) TPH1 mRNA in NEPC versus CRPC-Adeno (Beltran 2016 [ref. 15], GSE74685, and GSE32967), as well as in a PC cohort (GSE126078) categorized by AR and NE status. (D) Gene set enrichment analysis (GSEA) of NEPC and androgen response gene sets enriched in TPH1-high versus -low CRPC patient samples from the Beltran 2016 dataset. (E) Western blot of TPH1, AR, PSA, SYP, and CD56 protein expression in a panel of human PC cell lines. Data represent mean ± SEM. Statistics were calculated using 1-way ANOVA with Tukey’s test (A and C, right panel), paired 2-tailed Student’s t test (B), unpaired 2-tailed Student’s t test (C, left 3 panels), or permutation test (D). *P < 0.05, **P < 0.01.
Next, we analyzed a panel of human PC cell lines and observed substantially higher TPH1 protein levels in AR– de novo small cell/NE cells, LASCPC-01 and NCI-H660, accompanied by the absence of prostate-specific antigen (PSA) and strong expression of NE markers, compared with several AR+ prostatic adenocarcinoma (AdPC) cell lines (LNCaP, C4-2, and VCaP). We also demonstrated upregulated TPH1 protein in Enz-resistant C4-2B (C4-2BENZR) cells, which model t-NEPC by loss of canonical AR signaling and acquisition of NE traits (16), compared with control cells (Figure 1E). Based on their differential TPH1 expression (Supplemental Figure 1D), we selected LNCaP, C4-2BENZR, and LASCPC-01 as the main cell line models for TPH1 manipulation. Notably, the brain-specific isoform TPH2 was undetected in all PC cell lines in contrast with its high level in mouse brain tissue (Supplemental Figure 1E). In parallel with the changes in TPH1 expression, we also found elevated serotonin levels in NEPC cells compared with AdPC cells (Supplemental Figure 1F), which was corroborated in selected tumor xenografts (Supplemental Figure 1G). We further examined TPH1 expression in another NEPC model characterized by dual ablation of RB1 and TP53 (17, 18). We found increased TPH1 expression in Rb1/p53 double-knockdown (DKD) LNCaP cells, as well as in NE-featured tumors from Pten/Rb1 double-knockout and Pten/Rb1/Trp53 triple-knockout genetically engineered mouse models (GEMMs) (Supplemental Figure 1, H and I). Furthermore, we demonstrated concurrent upregulation of TPH1 and NE markers by AR inactivation under culture in androgen-depleted media or Enz treatment, or by REST silencing, a neural transcription factor lost during progression to NEPC (19), in LNCaP cells (Supplemental Figure 1J). The effect of AR on TPH1 was also reflected in decreased TPH1, along with induced KLK3 and reduced NE markers in LNCaP cells after androgen stimulation with R1881 (Supplemental Figure 1K). Consistently, we also showed increased TPH1 mRNA levels in post-Enz relative to pre-Enz prostate tumors collected from the same individuals before and after 3 months of Enz treatment (Supplemental Figure 1L). Additionally, GSEA revealed that multiple gene sets related to key steps and regulation of the neurotransmitter system, including biosynthesis, transport, and secretion of neurotransmitters, were prevalently upregulated in the C4-2BENZR and NEPC patient samples compared with respective controls (Supplemental Figure 1M). Collectively, these results indicate that TPH1 is upregulated in NEPC.
TPH1 induces and maintains NEPC differentiation and growth. To determine TPH1 function in PC, we stably overexpressed wild-type (WT) or enzymatically inactive mutant (A300T) (20) TPH1 in TPH1-low LNCaP AdPC cells. WT TPH1 overexpression (OE) markedly increased serotonin secretion and cell proliferation compared with the control expressing an empty vector, while mutant TPH1 failed to do so (Figure 2, A–C). WT but not mutant TPH1 was also sufficient to facilitate the transition from a luminal to a NE, basal, mesenchymal, and stem-like mixed phenotype by inducing corresponding markers concomitant with downregulation of luminal markers, including AR and PSA, in LNCaP cells (Figure 2A). These changes were reversed by siRNA-mediated KD of TPH1 (Supplemental Figure 2, A and B). Gain of NE and other nonluminal lineage features freed LNCaP cells expressing WT but not mutant TPH1 from reliance on AR for increased proliferation in androgen-depleted media or under Enz treatment (Figure 2D). WT but not mutant TPH1 OE further resulted in an NE-like differentiated cell morphology (21) with increases in neurite number and length (Figure 2E). Moreover, we showed that OE of WT but not mutant TPH1 induced cell invasion and sphere formation, indicating enhanced metastatic potential and stemness, respectively (Figure 2, F and G). Additionally, we observed similar effects on lineage markers, cell morphology, and AR-independent proliferation upon TPH1 OE in C4-2 AdPC cells (Supplemental Figure 2, C–E). These results demonstrate that TPH1 promotes NE differentiation and aggressive behavior in AdPC cells through its enzymatic activity.
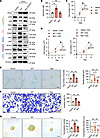 Figure 2
TPH1 confers a NE phenotype in AdPC cells. (A) Western blot of TPH1, luminal, NE, basal, stemness, and epithelial-mesenchymal transition (EMT) markers in control, WT, and mutant TPH1-OE LNCaP cells. (B) ELISA of serotonin levels in the culture media from control, WT, and mutant TPH1-OE LNCaP cells (n = 3). (C) Proliferation of control, WT, and mutant TPH1-OE LNCaP cells (n = 3). (D) Proliferation of control, WT, and mutant TPH1-OE LNCaP cells with 5% charcoal-stripped serum (CSS) or 10 μM Enz (n = 3). (E) Representative images of control, WT, and mutant TPH1-OE LNCaP cell morphology and quantification of per-cell neurite number and length in each group (n = 3, with >50 cells per group), representing 3 independent experiments. Scale bar: 20 μm. (F) Representative images and quantification of cell invasion by control, WT, and mutant TPH1-OE LNCaP cells (n = 3). Scale bar: 50 μm. (G) Representative images and quantification of the number and size of tumorspheres formed by control, WT, and mutant TPH1-OE LNCaP cells (n = 3). Scale bar: 50 μm. Data represent mean ± SEM. Statistics were calculated using 1-way ANOVA with Tukey’s test (B–G). **P < 0.01.
Conversely, we stably knocked down TPH1 expression in C4-2BENZR and LASCPC-01 cells, representing therapy-induced and de novo NEPC, respectively, using 2 independent shRNAs, which led to decreased serotonin secretion and proliferation (Figure 3, A–C, and Supplemental Figure 3A). We demonstrated that TPH1 knockdown (KD) slowed cell cycle progression but had minimal effects on cell apoptosis and senescence in these NEPC cells (Supplemental Figure 3, B–D). TPH1 KD also reduced NE, basal, stem cell, and mesenchymal markers in both cell lines (Figure 3A). GSEA of genes differentially expressed in TPH1-KD cells revealed repressed transcriptomic profiles compared with those in human NEPC (Figure 3D). Notably, re-expression of TPH1 in TPH1-KD cells restored proliferation and expression of NE and other nonluminal lineage markers (Supplemental Figure 4, A and B). TPH1 silencing also markedly impaired the invasion and sphere formation of NEPC cells (Figure 3, E and F, and Supplemental Figure 4C). Moreover, we observed reductions in serotonin secretion, NE marker expression, and proliferation of NCI-H660 cells after silencing TPH1 with 2 siRNAs (Supplemental Figure 4, D–F). TPH1 KD also decreased cell proliferation and NE marker expression and induced dedifferentiated cell morphology in Rb1/p53 DKD LNCaP cells (Supplemental Figure 4, G–I). Then, using organoids derived from TPH1-high NEPC PDX tumors (LuCaP 49, 93, and 173.1) (22) (Supplemental Figure 5A), we demonstrated notable reductions in organoid growth and NE markers following effective TPH1 KD (Figure 4, A and B, and Supplemental Figure 5, B and C).
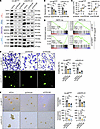 Figure 3
TPH1 silencing impairs NE plasticity and aggressive behavior in NEPC cells. (A) Western blot of TPH1, NE, basal, stemness, and EMT markers in control and TPH1-KD NEPC cells. (B) ELISA of serotonin levels in the culture media of control and TPH1-KD NEPC cells (n = 3). (C) Proliferation of control and TPH1-KD NEPC cells (n = 3). (D) GSEA of NEPC gene signatures enriched in TPH1-KD versus control NEPC cells. (E) Representative images and quantification of cell invasion by control and TPH1-KD NEPC cells (n = 3). Scale bars: 50 μm. (F) Representative images and quantification of the number and size of tumorspheres formed by control and TPH1-KD NEPC cells (n = 3). Scale bar: 50 μm. Data represent mean ± SEM. Statistics were calculated using 1-way ANOVA with Dunnett’s test (B, C, E, and F) or permutation test (D). *P < 0.05, **P < 0.01.
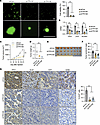 Figure 4
TPH1 depletion suppresses NEPC organoid and tumor growth. (A) Representative fluorescence microscopic images and viability of control and TPH1-KD LuCaP 49 PDX-derived organoids (n = 3). Scale bars: 100 μm. (B) qPCR of TPH1, SYP, and NCAM1 in control and TPH1-KD organoids as in A (n = 3). (C–E) Tumor growth curves (C), endpoint tumor weights (D), and anatomical tumor image (E) of control (shCon) and TPH1-KD (shTPH1) LASCPC-01 xenografts grown s.c. in male NSG mice (n = 8). (F) ELISA of serotonin levels in control and TPH1-KD LASCPC-01 tumors (n = 6). (G) Representative IHC staining of TPH1, Ki-67, SYP, and CD56 and quantification of percentage of Ki-67+ cells (n = 3) in control and TPH1-KD LASCPC-01 tumors. Scale bar: 20 μm. Data represent mean ± SEM. Statistics were calculated using 1-way ANOVA with Dunnett’s test (A–D, F, and G). **P < 0.01.
To analyze the consequences of TPH1 silencing in vivo, we subcutaneously grafted control and TPH1-KD LASCPC-01 cells into immunodeficient male mice. TPH1 silencing reduced tumor growth rate, tumor weight, and tumor serotonin levels (Figure 4, C–F). IHC confirmed sustained lower TPH1 protein expression and revealed a 78% average drop in the percentage of Ki-67+ cells, reflecting decreased cell proliferation, as well as reductions in the NE markers SYP and CD56 in TPH1-KD tumors (Figure 4G). We also observed fewer formed tumors, slower tumor growth, and reduced tumor NE markers after TPH1 depletion in C4-2BENZR xenografts (Supplemental Figure 5, D–G). Together, these results indicate that TPH1 is both sufficient and necessary for NEPC differentiation and growth.
TPH1 activates mTOR to operate in NEPC through intracellular serotonin. Next, we investigated how TPH1 promotes NEPC growth and NE traits. GSEA identified several upregulated Hallmark gene signatures in TPH1-OE LNCaP cells (Figure 5A). Among the top 5 signatures, epithelial-mesenchymal transition (EMT), hypoxia, mTORC1 signaling, and cholesterol homeostasis have been implicated in NEPC (23–26). Given serotonin’s known effect on mTOR activity and mTOR’s central role in mTORC1 signaling (25, 27), we focused on mTOR as a potential mediator of TPH1 function. WT but not mutant TPH1 OE increased phosphorylation of mTOR and 2 mTORC1 downstream effectors, p70S6K and 4E-BP1, in LNCaP cells, suggesting that TPH1 activates mTOR through its enzymatic function, whereas TPH1 KD decreased their phosphorylation in C4-2BENZR and LASCPC-01 cells. Interestingly, AKT phosphorylation, a known upstream inducer of mTOR, remained stable (Figure 5B and Supplemental Figure 6A). Moreover, re-expressing TPH1 in TPH1-KD cells restored phosphorylation of mTOR, p70S6K, and 4E-BP1 to control levels (Supplemental Figure 6B). Given the reciprocal regulatory circuit between mTOR and AMPK signaling in the maintenance of cellular energy homeostasis (28), we also asked whether TPH1 affects AMPK signaling and found no change in AMPK phosphorylation in TPH1-OE or -KD PC cells (Supplemental Figure 6C). Functionally, we showed that rapamycin inhibition of mTOR reversed TPH1-induced proliferation and NE marker expression in LNCaP cells, with stronger effects in TPH1-OE cells (Figure 5, C and D), suggesting that the reversal is TPH1 dependent rather than a general inhibitory effect. Conversely, we stably expressed a doxycycline-inducible (Dox-inducible) TPH1 shRNA in C4-2BENZR and LASCPC-01 cells, and we demonstrated that rapamycin pretreatment abolished the decreases in proliferation and NE markers caused by Dox-induced TPH1 KD in these cells (Figure 5, E and F, and Supplemental Figure 6, D and E). We further showed that silencing Raptor, but not Rictor, repressed TPH1-induced proliferation and NE markers in LNCaP cells, implicating mTORC1 but not mTORC2 as the predominant mediator of TPH1 effects (Supplemental Figure 6, F and G). Consistently, TPH1 silencing in TRAMP-C2 mouse PC cells, derived from a TRAMP transgenic mouse model of NEPC (29), decreased serotonin secretion and downregulated mTOR, p70S6K, and 4E-BP1 phosphorylation, as well as NE markers (Supplemental Figure 7, A and B). These data suggest that mTOR mediates TPH1 function in NEPC cells.
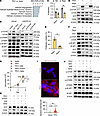 Figure 5
TPH1 activates mTOR through intracellular serotonin in NEPC cells. (A) GSEA of the top 5 Hallmark gene sets positively enriched in TPH1-OE LNCaP cells. (B) Western blot of mTOR and related phosphoproteins in control and TPH1-manipulated PC cells. p-, phosphorylated. (C) Proliferation of control and TPH1-OE LNCaP cells with rapamycin (25 nM, 3 days) (n = 3). (D) Western blot of TPH1, p-mTOR, and NE markers in control and TPH1-OE LNCaP with rapamycin for 48 hours. (E) Proliferation of Dox-inducible TPH1-KD LASCPC-01 cells pretreated with rapamycin for 24 hours followed by Dox stimulation (100 ng/mL, 3 days) (n = 3), with the percentage of proliferation inhibition shown. (F) Western blot of TPH1, p-mTOR, p-4E-BP1, and NE markers in LASCPC-01 cells as in E. (G) Proliferation of control and TPH1-OE LNCaP cells with 10 μM asenapine (ASE), 2 μM sertraline (Setra), or TPH1 siRNA (n = 3). (H) Western blot of NE markers in control and TPH1-OE LNCaP cells under the same treatments as in G for 48 hours. (I) Representative IF staining and quantification of per-cell perinuclear intracellular serotonin in control and TPH1-OE LNCaP cells, with more than 350 cells per group. Scale bar: 20 μm. (J) Western blot of mTOR and downstream phosphoproteins in control and TPH1-OE LNCaP cells with ASE, Setra, or 200 μM MDC for 30 minutes. Data represent mean ± SEM. Statistics were calculated using 2-way ANOVA with Holm-Šídák test (C), unpaired 2-tailed Student’s t test (E and I), or 1-way ANOVA with Tukey’s test (G). **P < 0.01.
We then examined whether extracellular versus intracellular serotonin mediates TPH1’s effects, including mTOR activation, in NEPC. TPH1 controls the synthesis of intracellular serotonin, which forms covalent bonds with glutamine (Gln) residues on substrate proteins via transamidation, primarily mediated by transglutaminase 2 (TGM2), to modulate their activities, a serotonin receptor–independent (5-HTR–independent) posttranslational modification known as serotonylation (30). Extracellular serotonin released from cells binds to cell surface 5-HTRs to trigger downstream signaling, a mechanism reported to activate mTOR via 5-HTR6 (31). To discern the role of extracellular versus intracellular serotonin in mediating TPH1 function, we treated TPH1-OE LNCaP cells with asenapine, a broad-spectrum 5-HTR antagonist, or sertraline, an inhibitor of serotonin transporter (SERT) for cellular reuptake of released extracellular serotonin. Neither treatment substantially affected TPH1-induced proliferation or NE markers, unlike TPH1 silencing in parallel (Figure 5, G and H). Conversely, exogenous serotonin failed to rescue the reduced proliferation, NE markers, and mTOR phosphorylation caused by TPH1 KD in C4-2BENZR and LASCPC-01 cells (Supplemental Figure 8, A–C). This aligns with the minimal changes in AKT phosphorylation following TPH1 manipulation, suggesting that TPH1 activates mTOR through a mechanism that likely differs from the canonical AKT-dependent pathway downstream of extracellular serotonin and 5-HTRs (13). These data suggest that TPH1 tends to activate mTOR for NEPC promotion independently of extracellular serotonin.
To explore whether intracellular serotonin mediates TPH1-dependent mTOR activation, we first confirmed increased intracellular serotonin around the nucleus as reported (32) in TPH1-OE LNCaP cells (Figure 5I). Blockade of TGM2-mediated serotonylation with monodansylcadaverine (MDC), but not 5-HTR or SERT inhibition, reduced TPH1-induced phosphorylation of mTOR, p70S6K, and 4E-BP1 in LNCaP cells, suggesting intracellular serotonin’s contribution to mTOR activation in the TPH1 context (Figure 5J). Alternatively, we treated LNCaP cells with 5-hydroxytryptophan (5-HTP), the immediate serotonin precursor converted from l-tryptophan by TPH1, which increases intracellular serotonin by bypassing the rate-limiting biosynthesis step (33). Unlike serotonin, which is primarily transported into cells via SERT (34), 5-HTP enters cells efficiently via facilitated or passive diffusion (35). 5-HTP induced mTOR activation, proliferation, and NE markers in LNCaP cells (Supplemental Figure 8, D and E). In contrast, exogenous serotonin increased proliferation and NE marker expression in LNCaP cells only when SERT was forcibly expressed (Supplemental Figure 8, F–H). Similarly, 5-HTP rescued proliferation that was repressed by TPH1 KD in C4-2BENZR and LASCPC-01 cells, whereas serotonin required concurrent forced SERT expression to do so (Supplemental Figure 8I). Collectively, these results suggest that TPH1 activates mTOR through TPH1-dependent intracellular serotonin to operate in NEPC.
In addition to the mTOR-targeted mechanism identified by bioinformatic analysis, we examined whether estrogen signaling contributes to TPH1 function in NEPC, given its reported regulation of tryptophan hydroxylase and serotonin synthesis in the brain (36) and its upregulation during PC progression, including NEPC, particularly via ERα (37, 38). Although 17β-estradiol (E2) levels were elevated in NEPC cells alongside TPH1 and serotonin (Supplemental Figure 9A), E2 treatment neither affected TPH1 and NE marker levels and proliferation in LNCaP cells nor restored the reduced NE markers and proliferation caused by TPH1 KD in NEPC cells (Supplemental Figure 9, B–F). Conversely, blockade of estrogen signaling with the aromatase inhibitor letrozole or the ER antagonist fulvestrant failed to alter TPH1 and NE marker expression and proliferation of C4-2BENZR cells, nor did it repress TPH1-induced proliferation of LNCaP cells (Supplemental Figure 9, G–I). As parallel controls, E2 increased expression of estrogen-responsive genes and proliferation, whereas letrozole and fulvestrant downregulated E2 secretion and ERα protein expression, respectively, in MCF-7 cells (Supplemental Figure 9, J–M). Consistently, siRNA-mediated silencing of individual ERs produced minimal changes in TPH1 and SYP protein expression and proliferation in C4-2BENZR cells (Supplemental Figure 9, N and O). Additionally, depleting ERα or ERβ did not reverse TPH1-induced cell proliferation and NE markers in LNCaP cells (Supplemental Figure 9, P and Q). These results suggest potential tissue context–dependent estrogen regulation of tryptophan hydroxylases and, further, a low likelihood that TPH1 functions in NEPC through estrogen signaling in our models.
TPH1 triggers mTOR serotonylation at Gln2453 for activation. Investigating whether TPH1 regulates mTOR through serotonylation, we found elevated mTOR serotonylation in TPH1-OE LNCaP cells, which was reversed by the TGM2 inhibitor MDC (Figure 6A). In situ proximity ligation assays further revealed a 3-fold increase in mTOR-TGM2 interaction in TPH1-OE LNCaP cells and a 36% reduction in TPH1-KD C4-2BENZR cells compared with respective controls (Figure 6B and Supplemental Figure 10A). To map the mTOR region for TGM2 binding, which may contain key Gln residue(s) involved in mTOR serotonylation, we cloned full-length (FL) mTOR and 2 truncation mutants, including only the kinase domain or lacking the kinase domain (ΔKD) due to its critical role in mTOR’s activity (Figure 6C). Co-immunoprecipitation (co-IP) assays indicated that the kinase domain (aa 2,181–2,516) (39) was sufficient and necessary for mTOR to interact with TGM2 (Figure 6D). Reciprocally, we generated FL TGM2 and 2 mutant versions, one containing only the catalytic core domain and another lacking this domain (ΔCCD), based on its importance for enzyme activity (Figure 6E). Co-IP assays revealed that the catalytic domain is required for TGM2 to interact with mTOR (Figure 6F). These data suggest that TPH1 enables serotonylation of mTOR, likely via specific Gln residue(s) within the kinase domain.
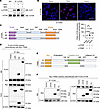 Figure 6
TPH1 enhances mTOR serotonylation and mTOR-TGM2 interaction. (A) Co-IP assay of mTOR-serotonin interaction in control and TPH1-OE LNCaP cells with MDC (200 μM, 24 hrs), with normalized serotonylated mTOR (s-mTOR) levels in untreated control cells set as 1. (B) Representative proximity ligation assay staining and quantification of mTOR-TGM2 interaction by per-cell cytoplasmic fluorescence intensity in control and TPH1-OE LNCaP cells. Scale bar: 50 μm. (C and D) Co-IP assay of FL or truncated FLAG-mTOR constructs (C) cotransfected with Myc-TGM2 construct in HEK293T cells (D). (E and F) Co-IP assay of FL or truncated Myc-TGM2 (E) cotransfected with FLAG-mTOR in HEK293T cells (F). Data represent mean ± SEM. Statistics were calculated using 1-way ANOVA with Dunnett’s test (B). **P < 0.01.
Given that TGMs preferentially modify glutamines in unstructured regions like flexible loops (40), we examined a reported 55-residue unstructured segment (aa 2,437–2,491) within the mTOR kinase domain (41) and identified Gln2453 as its only Gln residue. Notably, deleting the bulk of this segment (aa 2,443–2,486) was shown to deactivate mTOR (41). We also found that the Gln2453 and flanking sequences are highly conserved across different species (Figure 7A). In vitro TGM2 monoaminylation assays using recombinant truncated mTOR protein (aa 2,226–2,488) demonstrated that mTOR exhibited TGM2-dependent transamidation of MDC, which was attenuated by the TGM2 inhibitor cystamine and donor competition with serotonin, with recombinant fibrinogen protein as a positive control (42) (Figure 7B). Targeted liquid chromatography-tandem mass spectrometry (LC-MS/MS) following TGM2 assays using truncated mTOR protein with MDC further revealed Gln2453, but not Gln2282, which resides outside the unstructured region and thus served as a control, as a reactive substrate for serotonylation (Figure 7C). This was confirmed using a synthesized Gln2453-centered peptide, 2446TDSYSAGQSVEILDG2460, with MDC or serotonin (Supplemental Figure 10, B and C). These data indicate that mTOR can be serotonylated at Gln2453.
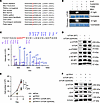 Figure 7
Serotonylation of Gln2453 promotes mTOR activity and TPH1 function in NEPC cells. (A) Conserved Gln2453 and flanking sequences on mTOR across different species. (B) TGM2 monoaminylation assays using human recombinant mTOR (aa 2,226–2,488) protein or fibrinogen protein as a control, under 4 mM cystamine or donor competition with excess 500 μM serotonin, shown as a representative of 3 independent experiments. (C) LC-MS/MS analysis of TGM2-transamidated MDC to recombinant mTOR protein (aa 2,226–2,488). (D) Western blot of mTOR and downstream phosphoproteins in LASCPC-01 cells transfected with WT or mutant (Q2453A) mTOR. (E) Proliferation of control and TPH1-KD LASCPC-01 cells expressing WT or mutant mTOR (n = 3). (F) Western blot of p-mTOR and NE markers in control and TPH1-KD LASCPC-01 cells expressing WT or mutant mTOR. Data represent mean ± SEM. Statistics were calculated using 1-way ANOVA with Tukey’s test (E). **P < 0.01.
To assess whether mTOR serotonylation impacts its activity, we demonstrated that WT but not catalytically dead mutant (W241A) (43) TGM2 enhanced mTOR phosphorylation in TPH1-OE LNCaP cells (Supplemental Figure 10D), whereas treatment with TGM2 siRNA or different inhibitors of TGM2, including MDC, cystamine, and LDN27219, reduced mTOR phosphoprotein in C4-2BENZR and LASCPC-01 cells (Supplemental Figure 10E). Importantly, we observed markedly reduced phosphorylation of mTOR, p70S6K, and 4E-BP1 in LASCPC-01 cells expressing the mutant mTOR (Q2453A), in which Gln2453 was replaced by alanine, compared with WT mTOR (Figure 7D), suggesting that Gln2453 influences mTOR activity. We further examined Rheb binding to mTOR, a critical step in allosteric activation of mTOR for mTORC1 activity (44). MDC treatment reduced the Rheb-mTOR interaction in both C4-2BENZR and 5-HTP–stimulated LNCaP cells as shown by co-IP and proximity ligation assays (Supplemental Figure 11, A and B). Similarly, the Q2453A mutation decreased the interaction between endogenous Rheb and transfected mTOR in C4-2BENZR and LASCPC-01 cells (Supplemental Figure 11, C and D). Structural modeling further revealed that Q2453A disrupts polar hydrogen-bond interactions between the side-chain amide group of Gln2453 and neighboring Gly2452/Ser2454 due to the shortened side chain and loss of hydrogen-bonding capacity, resulting in structural instability in this region (Supplemental Figure 11E). This may weaken mTOR’s interaction with other partners, such as Rheb, and warrants further investigation. Additionally, WT but not mutant mTOR rescued proliferation and NE marker expression reduced by TPH1 KD in LASCPC-01 cells, with restored mTOR activity compared with the control (Figure 7, E and F). Together, these results demonstrate that TPH1 induces mTOR serotonylation at Gln2453 to facilitate mTOR activation and mediate TPH1’s effect in NEPC cells.
TPH1 induces FOXM1 and E2F1 downstream of mTOR as TPH1 effectors. We carried out pathway analysis of RNA-seq data from TPH1-KD versus control C4-2BENZR cells and revealed FOXM1 as the most significantly downregulated (absolute value of z-score of ≥2 and P < 0.05) upstream regulator of the transcriptional changes (Figure 8A). FOXM1 is a master regulator of NEPC that interacts with NE differentiation factors and activates NEPC drivers, such as AURKA, which stabilize N-Myc to promote NEPC (45, 46). Promoter analysis of genes differentially expressed in TPH1-KD C4-2BENZR cells showed enrichment of E2F-binding sites (Figure 8B). E2F1 exhibits excessively high transcriptional activity in NEPC and confers NEPC development by transactivation of NE differentiation genes (47). Consistent with these findings, we demonstrated that FOXM1, E2F1, AURKA, and N-Myc protein levels were increased in WT but not mutant TPH1-OE LNCaP cells and reduced in TPH1-KD C4-2BENZR and LASCPC-01 cells (Figure 8C and Supplemental Figure 12A). We also found downregulated FOXM1 and E2F-directed gene signatures in TPH1-KD cells (Figure 8D).
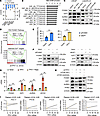 Figure 8
TPH1 induces FOXM1 and E2F1 via mTOR to function in NEPC cells. (A) Ingenuity Pathway Analysis (IPA; QIAGEN) upstream regulator analysis of RNA-seq data from TPH1-KD versus control C4-2BENZR cells, with significantly downregulated hits shown (P < 0.05). (B) GSEA of the top 10 enriched E2F-binding motifs in regions spanning 4 kb centered on the transcription start sites of genes differentially expressed in TPH1-KD versus control C4-2BENZR cells. (C) Western blot of FOXM1, E2F1, AURKA, and N-Myc in control and TPH1-manipulated PC cells. (D) GSEA of FOXM1 and E2F-directed gene sets enriched in TPH1-KD versus control C4-2BENZR cells. PID, Pathway Interaction Database. (E) Proliferation of control and TPH1-OE LNCaP cells with FOXM1 or E2F1 siRNAs for 3 days (n = 3), with percentage proliferation inhibition shown. (F) Western blot of FOXM1, E2F1, and NE markers in control and TPH1-OE LNCaP cells with FOXM1 or E2F1 siRNAs for 48 hours. (G) qPCR of FOXM1, E2F1, AURKA, and MYCN in control and TPH1-OE LNCaP cells with rapamycin (25 nM, 24 hrs) (n = 3). (H) Western blot of FOXM1, E2F1, AURKA, and N-Myc in control and TPH1-KD C4-2BENZR cells expressing WT or mutant (Q2453A) mTOR. (I) Pearson’s correlation analysis of TPH1 mRNA with mTOR score and FOXM1, E2F1, AURKA, and MYCN mRNA in the Beltran 2016 dataset. Data represent mean ± SEM. Statistics were calculated using permutation test (D), unpaired 2-tailed Student’s t test (E), 1-way ANOVA with Tukey’s test (G), or Pearson’s correlation coefficient t test (I). *P < 0.05, **P < 0.01.
To determine whether FOXM1 and E2F1 mediate TPH1’s effects in NEPC, we showed that FOXM1 or E2F1 silencing more effectively reduced proliferation and NE markers in TPH1-OE LNCaP cells than in control cells (Figure 8, E and F), indicating TPH1-dependent inhibitory effects. Conversely, preincubation with siRNAs against FOXM1 or E2F1 lessened the reductions in proliferation and NE markers caused by Dox-induced TPH1 KD in C4-2BENZR cells (Supplemental Figure 12, B and C). Moreover, rapamycin suppressed TPH1-induced expression of FOXM1, E2F1, AURKA, and MYCN in LNCaP cells (Figure 8G), whereas forced expression of WT but not mutant mTOR restored their expression following TPH1 KD in LASCPC-01 cells (Figure 8H). These data suggest that FOXM1, E2F1, and associated NEPC driver genes act downstream of mTOR in TPH1’s context. Additionally, we found that TPH1 tends to positively correlate with the mTOR score, defined by Hallmark mTORC1 signaling genes, as well as with FOXM1, E2F1, AURKA, and MYCN expression in the Beltran 2016 cohort (Figure 8I). Together, these data demonstrate FOXM1 and E2F1 as valid effectors downstream of mTOR mediating TPH1’s effects on NEPC.
Pharmacological TPH1 inhibition restricts NEPC differentiation and growth in vitro and in vivo. Next, we evaluated the efficacy of TPH1 inhibitors, specifically LX1606 (telotristat ethyl, Xermelo), an FDA-approved small-molecule tryptophan hydroxylase inhibitor used clinically to treat carcinoid syndrome diarrhea (48). Due to its inability to cross the blood-brain barrier and interfere with brain-specific TPH2, LX1606 selectively inhibits peripheral TPH1 and avoids adverse effects on the central nervous system (8).
We first assessed the specificity of LX1606 for TPH1. We showed that TPH1-high NEPC cells (LASCPC-01 and NCI-H660) are more responsive to LX1606, with up to 80% lower IC50 values than TPH1-low AdPC cells (LNCaP and C4-2) (Supplemental Figure 13A). Effective CRISPR/Cas9-mediated pooled TPH1 knockout in C4-2BENZR cells also abolished the inhibitory effects of LX1606 on proliferation and NE markers compared with control cells (Supplemental Figure 13, B–D), suggesting TPH1-specific targeting. LX1606 treatment at 2 and 5 μM, which inactivated TPH1 enzymatic activity by up to ~70% and decreased serotonin secretion, dose-dependently repressed proliferation, colony formation, invasion, and sphere formation in C4-2BENZR and LASCPC-01 cells (Figure 9, A–C, and Supplemental Figure 13, E–J). LX1606 also dose-dependently reduced protein levels of NE markers and TPH1 downstream effectors, including p-mTOR, FOXM1, and E2F1 (Figure 9D and Supplemental Figure 13K). Additionally, LX1606 enhanced the efficacy of cisplatin and carboplatin, 2 platinum-based agents currently used as standard NEPC therapies (49), reducing their IC50 values by 3.6- and 1.9-fold, respectively, in LASCPC-01 cells (Supplemental Figure 14).
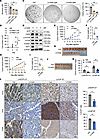 Figure 9
Pharmacological TPH1 inhibitor LX1606 restricts NEPC differentiation and growth. (A) ELISA of serotonin levels in the culture media of LASCPC-01 cells with LX1606 for 48 hours (n = 3). (B) Proliferation of LASCPC-01 cells with LX1606 (n = 3). (C) Representative images and quantification of soft-agar colony formation by LASCPC-01 cells with LX1606 (n = 3). (D) Western blot of SYP, CD56, p-mTOR, FOXM1, and E2F1 in LASCPC-01 cells with LX1606 for 3 days. (E–G) Tumor growth curves (E), endpoint tumor weights (F), and anatomic tumor image (G) of LASCPC-01 xenografts grown s.c. in male NSG mice receiving vehicle (Veh) or LX1606 (n = 10). (H–J) Tumor growth curves (H), endpoint tumor weights (I), and anatomic tumor image (J) of LuCaP 49 PDXs grown s.c. in male NSG mice receiving vehicle or LX1606 (n = 8). (K) ELISA of tumor serotonin levels in control and LX1606-treated groups (n = 8 or 10). (L) Representative IHC staining of Ki-67, SYP, and CD56 and quantification of percentage of Ki-67+ cells (n = 3) in control and LX1606-treated tumors. Scale bar: 20 μm. Data represent mean ± SEM. Statistics were calculated using 1-way ANOVA with Dunnett’s test (A–C) or unpaired 2-tailed Student’s t test (E, F, H, I, K, and L). *P < 0.05, **P < 0.01.
To address whether LX1606 inhibition of NEPC differentiation and growth in vitro translates in vivo, we established multiple TPH1-high NEPC xenograft mouse models. In mice bearing LASCPC-01 and NCI-H660 subcutaneous xenografts, LX1606 treatment slowed tumor growth and reduced endpoint tumor size and weight compared with vehicle controls (Figure 9, E–G, and Supplemental Figure 15, A–C). Similarly, LX1606 suppressed tumor growth in 3 NEPC PDX models (LuCaP 49, 93, and 173.1), resulting in smaller tumors and lower endpoint weights (Figure 9, H–J, and Supplemental Figure 15, D–I). LX1606 reduced tumor serotonin levels across all NEPC models (Figure 9K and Supplemental Figure 15J), confirming inhibition of tumor TPH1 activity, and decreased Ki-67+ cell percentages and NE marker expression (Figure 9L and Supplemental Figure 15K). LX1606 did not alter mouse body weight or cause apparent histopathological abnormalities in the liver or kidneys (Supplemental Figure 16, A and B). Additionally, we observed no substantial changes in tumor growth profiles, along with low and stable tumor serotonin levels, in parallel TPH1-low LNCaP AdPC xenografts (Supplemental Figure 17, A–E).
To further evaluate LX1606’s efficacy in t-NEPC, we found that LX1606 alone increased AR and PSA protein expression in C4-2BENZR cells, and its combination with Enz dramatically reduced their expression (Supplemental Figure 18A). Consistently, LX1606 restored Enz sensitivity, reducing Enz IC50 by nearly 2-fold and colony formation by 67% (Supplemental Figure 18, B and C). In C4-2BENZR subcutaneous xenografts, LX1606 alone reduced tumor growth and, importantly, resensitized resistant tumors to Enz, with the combination producing the greatest tumor suppression (Supplemental Figure 18, D–F). IHC revealed lower Ki-67+ cell percentages and CD56 expression in LX1606-treated tumors, with further decreases following combination treatment. Consistent with in vitro observations, LX1606 alone elevated AR and PSA expression, whereas combined treatment markedly reduced their expression in tumors (Supplemental Figure 18G). Revisiting LX1606-treated LASCPC-01 and LuCaP 49 NEPC tumors, we also demonstrated increased AR and PSA expression in treated tumors (Supplemental Figure 18H). Collectively, these results suggest that TPH1 inhibitors like LX1606 have strong potential to treat NEPC, including t-NEPC, both as monotherapy and in combination with existing therapies, such as ARSIs.


Copyright © 2026 American Society for Clinical Investigation
ISSN: 0021-9738 (print), 1558-8238 (online)