
Advertisement
Research ArticleCell biologyNeuroscienceOphthalmology
Open Access |  10.1172/JCI196705
Adam9-deficient retinal pigment epithelium pseudopods maintain photoreceptor outer segment renewal despite subretinal space expansion
Tylor R. Lewis,1,2 Carson M. Castillo,1 Sebastien Phan,3 Camilla R. Shores,4 Kylie K. Hayase,1 Keun-Young Kim,3 Mark H. Ellisman,3 Oleg Alekseev,1 Marie E. Burns,4,5 and Vadim Y. Arshavsky1,6
1Department of Ophthalmology, Duke University School of Medicine, Durham, North Carolina, USA.
2Department of Ophthalmology and Visual Sciences, University of Alabama at Birmingham, Birmingham, Alabama, USA.
3National Center for Microscopy and Imaging Research, School of Medicine, UCSD, La Jolla, California, USA.
4Department of Cell Biology and Human Anatomy and
5Center for Neuroscience and Department of Ophthalmology & Vision Science, UCD, Davis, California, USA.
6Department of Pharmacology and Cancer Biology, Duke University School of Medicine, Durham, North Carolina, USA.
Address correspondence to: Tylor R. Lewis, University of Alabama at Birmingham, 1670 University Blvd., Birmingham, Alabama 35233, USA. Phone: 205.996.8682; Email: tylorrlewis@uabmc.edu. Or to: Vadim Y. Arshavsky, Duke Eye Center, 2351 Erwin Rd., Box 3802, Durham, North Carolina 27710, USA. Phone: 919.668.5391; Email: vadim.arshavsky@duke.edu.
Find articles by Lewis, T. in: PubMed | Google Scholar
1Department of Ophthalmology, Duke University School of Medicine, Durham, North Carolina, USA.
2Department of Ophthalmology and Visual Sciences, University of Alabama at Birmingham, Birmingham, Alabama, USA.
3National Center for Microscopy and Imaging Research, School of Medicine, UCSD, La Jolla, California, USA.
4Department of Cell Biology and Human Anatomy and
5Center for Neuroscience and Department of Ophthalmology & Vision Science, UCD, Davis, California, USA.
6Department of Pharmacology and Cancer Biology, Duke University School of Medicine, Durham, North Carolina, USA.
Address correspondence to: Tylor R. Lewis, University of Alabama at Birmingham, 1670 University Blvd., Birmingham, Alabama 35233, USA. Phone: 205.996.8682; Email: tylorrlewis@uabmc.edu. Or to: Vadim Y. Arshavsky, Duke Eye Center, 2351 Erwin Rd., Box 3802, Durham, North Carolina 27710, USA. Phone: 919.668.5391; Email: vadim.arshavsky@duke.edu.
Find articles by Castillo, C. in: PubMed | Google Scholar
1Department of Ophthalmology, Duke University School of Medicine, Durham, North Carolina, USA.
2Department of Ophthalmology and Visual Sciences, University of Alabama at Birmingham, Birmingham, Alabama, USA.
3National Center for Microscopy and Imaging Research, School of Medicine, UCSD, La Jolla, California, USA.
4Department of Cell Biology and Human Anatomy and
5Center for Neuroscience and Department of Ophthalmology & Vision Science, UCD, Davis, California, USA.
6Department of Pharmacology and Cancer Biology, Duke University School of Medicine, Durham, North Carolina, USA.
Address correspondence to: Tylor R. Lewis, University of Alabama at Birmingham, 1670 University Blvd., Birmingham, Alabama 35233, USA. Phone: 205.996.8682; Email: tylorrlewis@uabmc.edu. Or to: Vadim Y. Arshavsky, Duke Eye Center, 2351 Erwin Rd., Box 3802, Durham, North Carolina 27710, USA. Phone: 919.668.5391; Email: vadim.arshavsky@duke.edu.
Find articles by Phan, S. in: PubMed | Google Scholar
1Department of Ophthalmology, Duke University School of Medicine, Durham, North Carolina, USA.
2Department of Ophthalmology and Visual Sciences, University of Alabama at Birmingham, Birmingham, Alabama, USA.
3National Center for Microscopy and Imaging Research, School of Medicine, UCSD, La Jolla, California, USA.
4Department of Cell Biology and Human Anatomy and
5Center for Neuroscience and Department of Ophthalmology & Vision Science, UCD, Davis, California, USA.
6Department of Pharmacology and Cancer Biology, Duke University School of Medicine, Durham, North Carolina, USA.
Address correspondence to: Tylor R. Lewis, University of Alabama at Birmingham, 1670 University Blvd., Birmingham, Alabama 35233, USA. Phone: 205.996.8682; Email: tylorrlewis@uabmc.edu. Or to: Vadim Y. Arshavsky, Duke Eye Center, 2351 Erwin Rd., Box 3802, Durham, North Carolina 27710, USA. Phone: 919.668.5391; Email: vadim.arshavsky@duke.edu.
Find articles by Shores, C. in: PubMed | Google Scholar
1Department of Ophthalmology, Duke University School of Medicine, Durham, North Carolina, USA.
2Department of Ophthalmology and Visual Sciences, University of Alabama at Birmingham, Birmingham, Alabama, USA.
3National Center for Microscopy and Imaging Research, School of Medicine, UCSD, La Jolla, California, USA.
4Department of Cell Biology and Human Anatomy and
5Center for Neuroscience and Department of Ophthalmology & Vision Science, UCD, Davis, California, USA.
6Department of Pharmacology and Cancer Biology, Duke University School of Medicine, Durham, North Carolina, USA.
Address correspondence to: Tylor R. Lewis, University of Alabama at Birmingham, 1670 University Blvd., Birmingham, Alabama 35233, USA. Phone: 205.996.8682; Email: tylorrlewis@uabmc.edu. Or to: Vadim Y. Arshavsky, Duke Eye Center, 2351 Erwin Rd., Box 3802, Durham, North Carolina 27710, USA. Phone: 919.668.5391; Email: vadim.arshavsky@duke.edu.
Find articles by Hayase, K. in: PubMed | Google Scholar
1Department of Ophthalmology, Duke University School of Medicine, Durham, North Carolina, USA.
2Department of Ophthalmology and Visual Sciences, University of Alabama at Birmingham, Birmingham, Alabama, USA.
3National Center for Microscopy and Imaging Research, School of Medicine, UCSD, La Jolla, California, USA.
4Department of Cell Biology and Human Anatomy and
5Center for Neuroscience and Department of Ophthalmology & Vision Science, UCD, Davis, California, USA.
6Department of Pharmacology and Cancer Biology, Duke University School of Medicine, Durham, North Carolina, USA.
Address correspondence to: Tylor R. Lewis, University of Alabama at Birmingham, 1670 University Blvd., Birmingham, Alabama 35233, USA. Phone: 205.996.8682; Email: tylorrlewis@uabmc.edu. Or to: Vadim Y. Arshavsky, Duke Eye Center, 2351 Erwin Rd., Box 3802, Durham, North Carolina 27710, USA. Phone: 919.668.5391; Email: vadim.arshavsky@duke.edu.
Find articles by Kim, K. in: PubMed | Google Scholar
1Department of Ophthalmology, Duke University School of Medicine, Durham, North Carolina, USA.
2Department of Ophthalmology and Visual Sciences, University of Alabama at Birmingham, Birmingham, Alabama, USA.
3National Center for Microscopy and Imaging Research, School of Medicine, UCSD, La Jolla, California, USA.
4Department of Cell Biology and Human Anatomy and
5Center for Neuroscience and Department of Ophthalmology & Vision Science, UCD, Davis, California, USA.
6Department of Pharmacology and Cancer Biology, Duke University School of Medicine, Durham, North Carolina, USA.
Address correspondence to: Tylor R. Lewis, University of Alabama at Birmingham, 1670 University Blvd., Birmingham, Alabama 35233, USA. Phone: 205.996.8682; Email: tylorrlewis@uabmc.edu. Or to: Vadim Y. Arshavsky, Duke Eye Center, 2351 Erwin Rd., Box 3802, Durham, North Carolina 27710, USA. Phone: 919.668.5391; Email: vadim.arshavsky@duke.edu.
Find articles by Ellisman, M. in: PubMed | Google Scholar
1Department of Ophthalmology, Duke University School of Medicine, Durham, North Carolina, USA.
2Department of Ophthalmology and Visual Sciences, University of Alabama at Birmingham, Birmingham, Alabama, USA.
3National Center for Microscopy and Imaging Research, School of Medicine, UCSD, La Jolla, California, USA.
4Department of Cell Biology and Human Anatomy and
5Center for Neuroscience and Department of Ophthalmology & Vision Science, UCD, Davis, California, USA.
6Department of Pharmacology and Cancer Biology, Duke University School of Medicine, Durham, North Carolina, USA.
Address correspondence to: Tylor R. Lewis, University of Alabama at Birmingham, 1670 University Blvd., Birmingham, Alabama 35233, USA. Phone: 205.996.8682; Email: tylorrlewis@uabmc.edu. Or to: Vadim Y. Arshavsky, Duke Eye Center, 2351 Erwin Rd., Box 3802, Durham, North Carolina 27710, USA. Phone: 919.668.5391; Email: vadim.arshavsky@duke.edu.
Find articles by Alekseev, O. in: PubMed | Google Scholar
1Department of Ophthalmology, Duke University School of Medicine, Durham, North Carolina, USA.
2Department of Ophthalmology and Visual Sciences, University of Alabama at Birmingham, Birmingham, Alabama, USA.
3National Center for Microscopy and Imaging Research, School of Medicine, UCSD, La Jolla, California, USA.
4Department of Cell Biology and Human Anatomy and
5Center for Neuroscience and Department of Ophthalmology & Vision Science, UCD, Davis, California, USA.
6Department of Pharmacology and Cancer Biology, Duke University School of Medicine, Durham, North Carolina, USA.
Address correspondence to: Tylor R. Lewis, University of Alabama at Birmingham, 1670 University Blvd., Birmingham, Alabama 35233, USA. Phone: 205.996.8682; Email: tylorrlewis@uabmc.edu. Or to: Vadim Y. Arshavsky, Duke Eye Center, 2351 Erwin Rd., Box 3802, Durham, North Carolina 27710, USA. Phone: 919.668.5391; Email: vadim.arshavsky@duke.edu.
Find articles by Burns, M. in: PubMed | Google Scholar
1Department of Ophthalmology, Duke University School of Medicine, Durham, North Carolina, USA.
2Department of Ophthalmology and Visual Sciences, University of Alabama at Birmingham, Birmingham, Alabama, USA.
3National Center for Microscopy and Imaging Research, School of Medicine, UCSD, La Jolla, California, USA.
4Department of Cell Biology and Human Anatomy and
5Center for Neuroscience and Department of Ophthalmology & Vision Science, UCD, Davis, California, USA.
6Department of Pharmacology and Cancer Biology, Duke University School of Medicine, Durham, North Carolina, USA.
Address correspondence to: Tylor R. Lewis, University of Alabama at Birmingham, 1670 University Blvd., Birmingham, Alabama 35233, USA. Phone: 205.996.8682; Email: tylorrlewis@uabmc.edu. Or to: Vadim Y. Arshavsky, Duke Eye Center, 2351 Erwin Rd., Box 3802, Durham, North Carolina 27710, USA. Phone: 919.668.5391; Email: vadim.arshavsky@duke.edu.
Find articles by Arshavsky, V. in: PubMed | Google Scholar
Published February 5, 2026 - More info
J Clin Invest. 2026;136(7):e196705. https://doi.org/10.1172/JCI196705.
© 2026 Lewis et al. This work is licensed under the Creative Commons Attribution 4.0 International License. To view a copy of this license, visit http://creativecommons.org/licenses/by/4.0/.
Received: July 3, 2025; Accepted: February 3, 2026


-
Results
Photoreceptor function in human vitelliform macular dystrophy is minimally affected. To highlight the impact of a pathological expansion of the subretinal space on photoreceptor function in humans, we present a multimodal assessment of a patient afflicted with vitelliform macular dystrophy type 2 caused by a pathogenic variant in BEST1 (c.17C>G, p.Thr6Arg) (11–13) (Figure 1). This asymptomatic 12-year-old female patient was evaluated due to a positive family history of macular disease. Imaging with optical coherence tomography (Figure 1A) and fundus autofluorescence photography (Figure 1B) revealed the presence of bilateral central vitelliform lesions. Despite the substantial separation of subfoveal photoreceptors from the RPE, the patient’s best-corrected visual acuity was logMAR 0.2 (Snellen equivalent 20/32) in each eye. Her central cone sensitivity was only minimally reduced on microperimetry testing (Figure 1C), and foveolar cone function was only borderline attenuated on multifocal electroretinography (ERG; index zone 1 in Figure 1D). These observations, consistent with other reports in patients having expansions in the subretinal space (e.g., refs. 5–7), led us to evaluate the degree to which a close apposition between photoreceptor outer segments and the RPE is essential for supporting photoreceptor cell function.
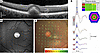 Figure 1
Vitelliform macular dystrophy is characterized by a separation of photoreceptors and the RPE without major early visual defects. Right eye of a 12-year-old patient with a subfoveal vitelliform lesion due to vitelliform macular dystrophy type 2. (A) Spectral-domain optical coherence tomography image through the foveola. ONL, outer nuclear layer; ELM, external limiting membrane; EZ, ellipsoid zone; IDZ, interdigitation zone. Scale bar: 200 μm. (B) Fundus autofluorescence photograph of the macula. (C) Microperimetry measurements at 73 macular locations superimposed on the corresponding fundus color photograph. The sensitivity scale (in dB) is shown at the bottom. (D) Multifocal ERG recordings obtained in a stimulus array of 61 elements. Individual responses were averaged within 5 different eccentricity ranges color-coded in the hexagon schematic and numbered as indexes in the table. Averaged response traces are coded in the same colors as the map and are arranged vertically from center to periphery. Averaged response density data are tabulated above. Black traces represent normative dataset references; gray boxes represent normal ranges of response amplitude and timing (vertical and horizontal dimensions, respectively).
Photoreceptor loss in the Adam9–/– mouse does not occur until after P60. To address the requirement for a close apposition between photoreceptors and the RPE in maintaining photoreceptor cells, we analyzed the Adam9–/– mouse (14) that had previously been established to display a separation between outer segments and the RPE at advanced stages of photoreceptor degeneration (8). Our first goal was to assess the time course of photoreceptor degeneration occurring in this mouse model, as the previous study (8) only analyzed Adam9–/– mice of 1 year of age or older. We analyzed the retinal morphology of younger Adam9–/– mice and found no signs of photoreceptor degeneration at either P30 or P60 (Figure 2). However, retinal degeneration in Adam9–/– mice took place at later ages, as approximately 30% of photoreceptors were lost by P180 and approximately 50% were lost by P365.
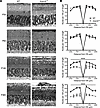 Figure 2
Loss of ADAM9 leads to a slow, progressive photoreceptor degeneration. (A) Representative light microscopy images of WT and Adam9–/– retinas at P30–P365. For each genotype at each time point, 3 retinas from separate mice were analyzed. ONL, outer nuclear layer. Scale bar: 20 μm. (B) Quantification of the number of photoreceptor nuclei in the ONL in 100 μm segments of retinal sections located at 500 μm intervals from the optic nerve (ON) at each time point. For each genotype at each time point, 3 retinas from separate mice were analyzed. Two-way ANOVA was used to compare the nuclear counts (not including the optic nerve) between genotypes at each time point. At P30 and P60, there was no statistically significant reduction in photoreceptor numbers in Adam9–/– retinas compared with WT retinas (P = 0.3443 and 0.2870, respectively). At each subsequent time point, there was a statistically significant reduction in photoreceptor numbers in Adam9–/– retinas compared with WT retinas (****P < 0.0001 for both P180 and P365). Data are presented as mean ± SEM.
We next analyzed photoreceptor function using ERG (Figure 3). While there were no overt defects in ERG responses of Adam9–/– mice at either P30 or P60, there was a decrease in the amplitudes of ERG a-wave responses in older Adam9–/– mice, with an approximately 30% reduction observed at P180 and approximately 50% reduction at P365. Because the ERG a-waves represent the compounded light responses of photoreceptor cells, a nearly perfect correspondence between the reduction in a-wave amplitudes and the number of surviving photoreceptors argues that the surviving photoreceptors remain fully functional at these ages. ERG b-wave responses, reflecting the activity of downstream bipolar cells, were affected as well, although to a lesser degree than a-waves. This is consistent with the underlying pathology originating from photoreceptors.
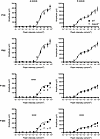 Figure 3
Loss of ADAM9 leads to a slow, progressive loss of visual function. ERG responses of dark-adapted WT and Adam9–/– mice at P30–P365 are plotted as a function of flash intensity and fit using a double- or single-hyperbolic function. Scotopic a-wave amplitudes are shown on the left, and scotopic b-wave amplitudes are shown on the right. For each genotype at each time point, at least 12 eyes were analyzed. Two-way ANOVA was used to determine whether there were any statistically significant differences in genotype/light intensity. At P30 and P60, there were no statistically significant differences in a-waves (P = 0.9622 and 0.9833, respectively) or b-waves (P > 0.9999 and 0.9987, respectively). At P180, there was a statistically significant difference in a-waves (****P < 0.0001) but not b-waves (P = 0.9987). At P365, there was a statistically significant difference in both a-waves (****P < 0.0001) and b-waves (****P < 0.0001). Data are presented as mean ± SEM.
Further evidence that photoreceptors of Adam9–/– mice remain functionally intact before they degenerate was obtained in single-cell recordings from their rods at P60 (Table 1). The average dark currents (Idark) and flash sensitivities (Io) were statistically indistinguishable from those obtained in photoreceptors of WT mice. The dim flash response kinetics of Adam9–/– rods, as measured by the time to peak, time constant of recovery (τrec), and integration time, were also not different from those of WT rods. These findings indicate that rods of Adam9–/– mice display a normal ability to produce responses to light.
Subretinal space expansion in the Adam9–/– mouse occurs early in photoreceptor development. We next used transmission electron microscopy (TEM) to analyze the ultrastructure of the outer segment–RPE interface of Adam9–/– mice (Figure 4). Strikingly, we found that the disruption in the normally close apposition between outer segments and the RPE, previously reported for aged mice (8), begins as early as P14. At this age, the subretinal space is expanded and filled with RPE microvilli that do not ensheathe outer segments. As Adam9–/– mice age, the gap between the RPE and outer segment tips widens and the network of RPE microvilli expands. Many of these microvilli appear to be swollen and some contain pigment granules displaced from the RPE somas. Of note, immunofluorescence imaging of RPE flatmounts from Adam9–/– mice did not reveal any overt pathology in the shape or structure of the RPE monolayer at P30 or P60, indicating that the expanded subretinal space is not immediately associated with RPE degeneration (Supplemental Figure 1; supplemental material available online with this article; https://doi.org/10.1172/JCI196705DS1). Importantly, the onset of the outer segment–RPE interface disruption precedes any signs of photoreceptor degeneration by over 6 weeks. This suggests that a close apposition between outer segments and the RPE is not required for maintaining photoreceptor health over a long period of time.
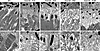 Figure 4
Loss of ADAM9 leads to an early separation of the outer segment–RPE interface. Representative TEM images of the photoreceptor outer segment–RPE interface in WT (P30) and Adam9–/– (P14–P180) mice. Higher magnification images are shown in the bottom panels. For each genotype at each time point, at least 3 retinas from separate mice were analyzed. OS, outer segment. Scale bars: 1 μm.
Subretinal space expansion in the Adam9–/– mouse does not affect normal outer segment renewal. We next sought to determine whether the separation between photoreceptors and the RPE in Adam9–/– mice affects the process of outer segment renewal. We first analyzed whether outer segment volume was altered in these mice prior to the onset of photoreceptor degeneration. Because rhodopsin represents >90% of the protein material within the outer segment membranes, its retinal content serves as a sensitive measure of the total outer segment volume. We determined the rhodopsin content in the retinas of Adam9–/– mice before the onset of photoreceptor degeneration using difference spectroscopy and found it to be the same as in WT mice (Supplemental Figure 2). Considering the unchanged total number of rods between these mice and the unchanged total rhodopsin content, we conclude that the volume of individual rod outer segments was unaffected by the loss of ADAM9.
We next analyzed the dynamics of outer segment renewal in Adam9–/– mice using a recently described approach (15). This approach takes advantage of the fact that the newly forming discs at the rod outer segment base are exposed to the extracellular space before becoming enclosed within the outer segment plasma membrane in the final step of their maturation (reviewed in ref. 16). Accordingly, these discs can entrap a membrane-impermeable fluorescent dye, CF-568-hydrazide, transiently introduced to the eye via an intravitreal injection. As outer segment renewal continues, discs containing the entrapped dye migrate outward along the outer segment axis. At any given time, the distance between the base of the outer segment and the dye band reflects the amount of new outer segment material added since the time of injection.
We intravitreally injected WT and Adam9–/– mice with CF-568-hydrazide at P30 when the gap between outer segments and the RPE is already present but before the onset of photoreceptor degeneration. At 6 days after injection, outer segments were isolated, stained with wheat germ agglutinin (WGA), and imaged (Figure 5). In both groups of P30 mice, a small band of the CF-568-hydrazide dye was observed at approximately 60% of the outer segment length from the base, reflecting the rate of outer segment renewal in WT mouse rods (~10% per day) established by multiple approaches (1), including previous experiments with CF-568-hydrazide in adult mice (17). Of note, following outer segment isolation for imaging, there appeared to be a small (~15%) decrease in their overall length in Adam9–/– mice. Considering the essentially normal volume of outer segments (as assumed from the total rhodopsin content above), this likely suggests that Adam9–/– outer segments may be more susceptible to mechanical damage at their tips. The normal rate of outer segment morphogenesis in P30 Adam9–/– mice suggests that the removal of old discs at the outer segment tips persists essentially normally despite the ongoing expansion of the subretinal space.
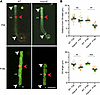 Figure 5
Loss of ADAM9 does not affect the dynamics of outer segment renewal before the onset of photoreceptor degeneration. (A) Photoreceptor cells from WT and Adam9–/– mice isolated 6 days after intravitreal injection of CF-568-hydrazide (red) and stained with WGA (green). The distance between the red band in the outer segment (OS) and its base near the inner segment (IS) reflects the new outer segment material formed within the time period following the injection. White arrowheads indicate the ends of the OS; red arrowheads indicate the CF-568-hydrazide band. For each genotype at each time point, 3 retinas from separate mice were analyzed. Scale bar: 5 μm. (B) Quantification of the position of the CF-568-hydrazide band as the distance from the outer segment base and quantification of the outer segment length. Individual points represent isolated cells from 1 of 3 different injected eyes (colored differently) for each genotype and age. The number of cells analyzed for each experiment were as follows: WT, P30 1: 25; WT, P30 2: 25; WT, P30 3: 25; Adam9–/–, P30 1: 25; Adam9–/–, P30 2: 25; Adam9–/–, P30 3: 13; WT, P180 1: 25; WT, P180 2: 25; WT, P180 3: 25; Adam9–/–, P180 1: 25; Adam9–/–, P180 2: 23; Adam9–/–, P180 3: 22. Unpaired t test, using the average value from each of the 3 eyes, showed no statistically significant difference between the location of the dye band in WT and Adam9–/– mice at P30 (P = 0.0678) but a statistically significant difference at P180 (**P = 0.0018). For outer segment length, there was a statistically significant difference between WT and Adam9–/– mice at P30 (**P = 0.0073) and at P180 (***P = 0.0009). Data are presented as mean ± SEM.
We next used this approach to analyze outer segment renewal at P180, following the onset of photoreceptor degeneration in Adam9–/– mice (Figure 5). Strikingly, we found that, in this case, outer segment renewal of P180 Adam9–/– mice was slowed by approximately 40% and was accompanied by an approximately 30% reduction in outer segment length.
RPE cells form extensive pseudopods to ingest outer segment tips in the Adam9–/– mouse. Our finding that, prior to photoreceptor degeneration, the rate of outer segment renewal is unaffected by Adam9–/– despite the subretinal space expansion led us to explore the mechanism supporting the unaltered rate of outer segment turnover. We envisioned two possibilities: (a) the RPE retains the ability to ingest outer segment material despite a separation between these 2 cell types, or (b) mononuclear phagocytes infiltrating the subretinal space (8) may instead fulfill this role. We first tested the role of the RPE by quantifying the number of outer segment–containing phagosomes in the RPE of WT and Adam9–/– mice at the diurnal peak of phagosome accumulation, which occurs shortly after light onset. We observed a small, yet not statistically significant, reduction in phagosome number and no change in phagosome size (Figure 6, A and B). This suggests that RPE cells retain a nearly normal ability to ingest outer segment material, despite the lack of a close apposition to photoreceptor cells. Intriguingly, phagosome number was significantly decreased at P180 after the onset of photoreceptor degeneration, which is consistent with our observation of decreased outer segment renewal at this time point.
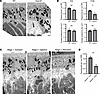 Figure 6
Loss of ADAM9 leads to the formation of elongated RPE pseudopods supporting outer segment renewal. (A) Representative TEM images of the outer segment–RPE interface in P30 WT and Adam9–/– mice. For each condition, 3 retinas from separate mice were analyzed. Black arrowheads indicate phagosomes. OS, outer segment. Scale bar: 1 μm. (B) Quantification of phagosome number (normalized to RPE length) and phagosome size at P30 and P180. For phagosome number, the RPE length analyzed was as follows: WT, P30 1: 497 μm; WT, P30 2: 520 μm; WT, P30 3: 420 μm; Adam9–/–, P30 1: 445 μm; Adam9–/–, P30 2: 433 μm; Adam9–/–, P30 3: 543 μm; WT, P180 1: 566 μm; WT, P180 2: 646 μm; WT, P180 3: 652 μm; Adam9–/–, P180 1: 642 μm; Adam9–/–, P180 2: 604 μm; Adam9–/–, P180 3: 629 μm. Unpaired t test showed a statistically significant difference in phagosome number between WT and Adam9–/– mice at P180 (*P = 0.0430) but not P30 (P = 0.0543). For phagosome size, 25 phagosomes from each sample were analyzed. Unpaired t test showed no statistically significant difference between phagosome size of WT and Adam9–/– mice at either P30 (P = 0.6883) or P180 (P = 0.6173). (C) Representative TEM images of pseudopods in P30 Adam9–/– mice at various stages of their formation. Scale bar: 1 μm. (D) Quantification of pseudopod number normalized to the RPE length analyzed. For each time point, at least 3 retinas from separate mice were analyzed. The RPE length analyzed was as follows: Adam9–/–, P30 1: 437 μm; Adam9–/–, P30 2: 394 μm; Adam9–/–, P30 3: 464 μm; Adam9–/–, P180 1: 390 μm; Adam9–/–, P180 2: 409 μm; Adam9–/–, P180 3: 394 μm, Adam9–/–, P180 4: 447 μm. Unpaired t test showed a statistically significant reduction in pseudopod number at P180 (**P = 0.0016). Data are presented as mean ± SEM.
Strikingly, Adam9–/– mice displayed elongated pseudopods extending from the RPE cell bodies to contact and ingest outer segment tips (Figure 6A). These pseudopods appeared to be dynamic structures captured in 3 different stages, as illustrated in Figure 6C. Some of them extended down to contact outer segment tips without containing phagosomes (stage 1, outreach), others were enriched with phagosomes (stage 2, ingestion), and some of them appeared in a state of retraction in which they contained phagosomes but no longer contacted outer segment tips (stage 3, retraction). In this analysis, we observed a pseudopod approximately every 30 μm of RPE length at P30 and about half as many at P180 (Figure 6D). The structure of these pseudopods can be particularly well appreciated in 3D electron tomograms spanning approximately 3 μm of retinal depth (Figure 7 and Supplemental Videos 1 and 2).
 Figure 7
3D reconstruction of an RPE pseudopod reaching across the expanded subretinal space of an Adam9–/– mouse. Segmentation of 3D electron tomograms (shown in Supplemental Video 1) obtained from 4 500-nm-thick serial sections across the retina of an Adam9–/– mouse. The RPE is pseudocolored in green with pigment granules in blue. Outer segments are pseudocolored in pink. Phagosomes containing outer segment material are pseudocolored in brown. For clarity, the RPE microvilli are omitted from the segmentation. One z-section from the tomogram is shown in the background. The segmented structure represents 1 of 5 electron tomograms taken from different pseudopods.
RPE pseudopods, also called phagocytic cups, have been previously observed in the process of outer segment ingestion in normal retinas (e.g., refs. 18, 19). Our current data demonstrate that the RPE has an innate ability to form much larger pseudopods to ingest outer segment tips across a pathologically expanded subretinal space. The formation of these pseudopods underlies the normal outer segment renewal in young Adam9–/– mice, thereby prolonging the survival of photoreceptor cells. The subsequent slowdown in outer segment renewal and the onset of photoreceptor degeneration in older Adam9–/– mice is associated with a reduction in pseudopod density.
Activated subretinal mononuclear phagocytes do not appear to modulate the pathology associated with loss of ADAM9. In another set of experiments, we explored whether the mononuclear phagocytes accumulating in the subretinal space of Adam9–/– mice (Figure 8A) may contribute to supporting outer segment renewal and maintaining photoreceptor health. Subretinal immune cells have been observed in many models of retinal degeneration, and it has been debated whether they serve a protective, harmful, or perhaps even neutral role (reviewed in ref. 20). We found that in the Adam9–/– retinas, the IBA1+ mononuclear phagocytes are also CD68+ (Figure 8B), suggesting that they are activated (21). These cells are observed in the subretinal space as early as P30 and densely populate this area by P60 (Figure 8, C and D). Interestingly, their migration to this space occurs at least 1 month prior to any observable photoreceptor degeneration. Once in the subretinal space, these phagocytes are closely interdigitated with the photoreceptor outer segments and contain ingested outer segment material (Figure 8A and Supplemental Figure 3). Since these immune cells have the capacity to ingest outer segment material, they could, in principle, contribute to the process of outer segment renewal.
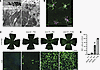 Figure 8
Activated mononuclear phagocytes infiltrate the subretinal space of Adam9–/– mice prior to photoreceptor degeneration. (A) Representative TEM image of a mononuclear phagocyte in the subretinal space of an Adam9–/– mouse at P30 (note that the image contains an overlapping field of view with the image in Figure 6C). Boxed inset is shown on the right. Three retinas from separate mice were analyzed. Arrowhead indicates ingested outer segment material inside. OS, outer segment. Scale bars: 2.5 μm. (B) Representative immunofluorescence images of RPE flatmounts of an Adam9–/– mouse at P60 stained with IBA1 (green), a marker for mononuclear phagocytes, and CD68 (magenta), a marker highly enriched in activated microglia in the retina (36). Three eyes from separate mice were analyzed. Scale bar: 20 μm. (C) RPE flatmounts of WT (P30) and Adam9–/– (P30–P180) mice stained with IBA1. Whole flatmounts are shown in the overview on the top; high-magnification insets are shown on the bottom. For each group, 3 eyes from separate mice were analyzed. Scale bars: 1,000 μm (top), 100 μm (bottom). (D) Quantification of the number of IBA+ cells in a 500 μm × 500 μm area averaged across 4, 500 μm intervals from the optic nerve (dorsal, nasal, ventral, and temporal). For each group, 3 eyes from separate mice were analyzed.
To assess the contribution of mononuclear phagocytes in modulating the pathology in Adam9–/– mice, we depleted them using PLX3397, a CSF1R inhibitor that nearly completely eliminates all myeloid cells from mouse nervous tissues (22), including the retina (23). We first verified the efficacy of this treatment by showing that PLX3397 administered to Adam9–/– mice starting at P60 depleted the subretinal IBA1+ cells within 30 days (Figure 9A).
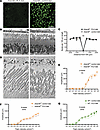 Figure 9
Ablation of subretinal mononuclear phagocytes does not affect the pathology associated with loss of ADAM9. (A) Representative immunofluorescence images of RPE flatmounts stained with IBA1 to label subretinal mononuclear phagocytes from P90 Adam9–/– mice fed a diet with or without PLX3397 (PLX) beginning at P60. For each group, 3 mice were analyzed. Scale bar: 100 μm. (B) Representative light microscopy images of Adam9–/– retinas treated with control or PLX diet from P30 through P180. For each condition, 4 mice were analyzed. OS, outer segment; ONL, outer nuclear layer. Scale bar: 10 μm. (C) Quantification of the number of photoreceptor nuclei. ON, optic nerve. For each condition, 4 mice were analyzed. Two-way ANOVA was used to determine that there was a statistically significant increase in photoreceptor numbers in PLX-treated retinas compared with control retinas (P = 0.0090). (D) Representative TEM images of control and PLX-treated Adam9–/– retinas. For each condition, 4 mice were analyzed. Scale bar: 5 μm. (E) ERG scotopic a-wave response of dark-adapted control and PLX-treated Adam9–/–. For control diet, 18 eyes were analyzed. For PLX diet, 14 eyes were analyzed. Two-way ANOVA showed no statistically significant difference in genotype/light intensity (P = 0.1049). (F) ERG scotopic b-wave response of dark-adapted control and PLX-treated Adam9–/– mice. For control diet, 18 eyes were analyzed. For PLX diet, 14 eyes were analyzed. Two-way ANOVA was used to determine that there was a statistically significant difference in genotype/light intensity (****P < 0.0001). (G) ERG scotopic b-wave response of dark-adapted control and PLX-treated WT mice. For control diet, 12 eyes were analyzed. For PLX diet, 16 eyes were analyzed. Two-way ANOVA showed a statistically significant difference in genotype/light intensity (****P < 0.0001). Data are presented as mean ± SEM.
We next sought to analyze the effects of mononuclear phagocyte depletion on the pathology occurring in Adam9–/– mice. We treated these mice with PLX3397, beginning at P30, when IBA1+ cells are first detected in the subretinal space, until P180, when substantial photoreceptor degeneration has already occurred. We found that the ablation of these cells led to a very small yet statistically significant increase in the number of remaining photoreceptor nuclei (Figure 9, B and C), although there was no discernible change in the ultrastructure of photoreceptor cells or the subretinal space (Figure 9D). To determine whether PLX3397 treatment promoted the function of remaining photoreceptor cells, we performed ERG recordings from treated and untreated Adam9–/– mice and found no statistically significant difference in the amplitudes of a-waves produced by photoreceptors (Figure 9E). This may suggest that the small increase in the nuclear count in Figure 9C merely reflects the persistence of dead photoreceptor nuclei that are not cleared away by the mononuclear phagocytes. However, PLX3397 caused a small reduction in the amplitude of b-waves produced by bipolar cells downstream from photoreceptors (Figure 9F). Given that microglia play a homeostatic role in maintaining photoreceptor-to-bipolar cell synapses (24), we reasoned that this small decrease did not reflect the pathology taking place at the photoreceptor-RPE interface but rather may be attributed to the impaired maintenance of photoreceptor synapses in the absence of microglia. Consistent with this idea, we found that b-wave amplitudes of WT mice treated with PLX3397 were reduced to a similar degree as those in treated Adam9–/– mice (Figure 9G). Overall, we did not find any evidence to suggest that mononuclear phagocytes infiltrating the subretinal space of Adam9–/– mice meaningfully modulate the ongoing pathology.


Copyright © 2026 American Society for Clinical Investigation
ISSN: 0021-9738 (print), 1558-8238 (online)