
Advertisement
Clinical Research and Public HealthClinical ResearchImmunology
Open Access |  10.1172/JCI208686
Digital cytometry of leukocyte landscapes reveals shared correlates of rejection across organ transplants
Patrick T. Gauthier,1,2 Louisa M.S. Gerhardt,3 Lorenz Jahn,4 Christian Hinze,4 Philip F. Halloran,1,2,5 and INTERCOMEX, INTERHEART, INTERLUNG, and INTERLIVER investigators6
1Alberta Transplant Applied Genomics Centre, Edmonton, Alberta, Canada.
2Transcriptome Sciences Inc., Edmonton, Alberta, Canada.
3Department of Medicine V, University Medical Centre Mannheim, University of Heidelberg, Mannheim, Germany.
4Department of Nephrology and Hypertension, Hannover Medical School, Hannover, Germany.
5University of Alberta, Edmonton, Alberta, Canada.
6See Supplemental Table 7 for affiliations.
Address for correspondence. Philip F. Halloran, Alberta Transplant Applied Genomics Centre, #250 Heritage Medical Research Centre, University of Alberta, Edmonton, Alberta T6G 2S2, Canada. Email: phallora@ualberta.ca.
Find articles by Gauthier, P. in: PubMed | Google Scholar
1Alberta Transplant Applied Genomics Centre, Edmonton, Alberta, Canada.
2Transcriptome Sciences Inc., Edmonton, Alberta, Canada.
3Department of Medicine V, University Medical Centre Mannheim, University of Heidelberg, Mannheim, Germany.
4Department of Nephrology and Hypertension, Hannover Medical School, Hannover, Germany.
5University of Alberta, Edmonton, Alberta, Canada.
6See Supplemental Table 7 for affiliations.
Address for correspondence. Philip F. Halloran, Alberta Transplant Applied Genomics Centre, #250 Heritage Medical Research Centre, University of Alberta, Edmonton, Alberta T6G 2S2, Canada. Email: phallora@ualberta.ca.
Find articles by Gerhardt, L. in: PubMed | Google Scholar
1Alberta Transplant Applied Genomics Centre, Edmonton, Alberta, Canada.
2Transcriptome Sciences Inc., Edmonton, Alberta, Canada.
3Department of Medicine V, University Medical Centre Mannheim, University of Heidelberg, Mannheim, Germany.
4Department of Nephrology and Hypertension, Hannover Medical School, Hannover, Germany.
5University of Alberta, Edmonton, Alberta, Canada.
6See Supplemental Table 7 for affiliations.
Address for correspondence. Philip F. Halloran, Alberta Transplant Applied Genomics Centre, #250 Heritage Medical Research Centre, University of Alberta, Edmonton, Alberta T6G 2S2, Canada. Email: phallora@ualberta.ca.
Find articles by Jahn, L. in: PubMed | Google Scholar
1Alberta Transplant Applied Genomics Centre, Edmonton, Alberta, Canada.
2Transcriptome Sciences Inc., Edmonton, Alberta, Canada.
3Department of Medicine V, University Medical Centre Mannheim, University of Heidelberg, Mannheim, Germany.
4Department of Nephrology and Hypertension, Hannover Medical School, Hannover, Germany.
5University of Alberta, Edmonton, Alberta, Canada.
6See Supplemental Table 7 for affiliations.
Address for correspondence. Philip F. Halloran, Alberta Transplant Applied Genomics Centre, #250 Heritage Medical Research Centre, University of Alberta, Edmonton, Alberta T6G 2S2, Canada. Email: phallora@ualberta.ca.
Find articles by Hinze, C. in: PubMed | Google Scholar
1Alberta Transplant Applied Genomics Centre, Edmonton, Alberta, Canada.
2Transcriptome Sciences Inc., Edmonton, Alberta, Canada.
3Department of Medicine V, University Medical Centre Mannheim, University of Heidelberg, Mannheim, Germany.
4Department of Nephrology and Hypertension, Hannover Medical School, Hannover, Germany.
5University of Alberta, Edmonton, Alberta, Canada.
6See Supplemental Table 7 for affiliations.
Address for correspondence. Philip F. Halloran, Alberta Transplant Applied Genomics Centre, #250 Heritage Medical Research Centre, University of Alberta, Edmonton, Alberta T6G 2S2, Canada. Email: phallora@ualberta.ca.
Find articles by Halloran, P. in: PubMed | Google Scholar
1Alberta Transplant Applied Genomics Centre, Edmonton, Alberta, Canada.
2Transcriptome Sciences Inc., Edmonton, Alberta, Canada.
3Department of Medicine V, University Medical Centre Mannheim, University of Heidelberg, Mannheim, Germany.
4Department of Nephrology and Hypertension, Hannover Medical School, Hannover, Germany.
5University of Alberta, Edmonton, Alberta, Canada.
6See Supplemental Table 7 for affiliations.
Address for correspondence. Philip F. Halloran, Alberta Transplant Applied Genomics Centre, #250 Heritage Medical Research Centre, University of Alberta, Edmonton, Alberta T6G 2S2, Canada. Email: phallora@ualberta.ca.
Published September 22, 2026 - More info
J Clin Invest. 2026;136(22):e208686. https://doi.org/10.1172/JCI208686.
© 2026 Gauthier et al. This work is licensed under the Creative Commons Attribution 4.0 International License. To view a copy of this license, visit http://creativecommons.org/licenses/by/4.0/.
Received: May 11, 2026; Accepted: September 15, 2026

-
Introduction
Despite advances in organ transplantation, rejection-related graft loss remains problematic. In previous studies, we defined the molecular basis of the rejection states using genome-wide bulk transcriptomic analysis of organ allograft biopsies in the Molecular Microscope Diagnostic System (MMDx), which provided insights into the mechanisms of T cell–mediated rejection (TCMR) and antibody-mediated rejection (ABMR) (1–3). MMDx defined molecular TCMR in large cohorts of kidney, heart, lung, and liver transplant biopsies prospectively collected in registered clinical trials (4–7). All rejection manifested increased expression of pan-rejection transcripts, such as IFNG-inducible transcripts (e.g., CXCL11) and transcripts shared by T cells and natural killer (NK) cells (e.g., KLRD1) (8). TCMR in all organs displayed transcripts typical of activated effector T cells (e.g., IFNG) and classically activated macrophages (e.g., ADAMDEC1) (9). MMDx also defined a molecular ABMR state in kidney and heart transplant biopsies displaying increased expression of transcripts typical of NK cells (e.g., FGFBP2) and endothelial cells (e.g., ROBO4) (10–12), but found no similar molecular ABMR state in lung (13) or liver (14) transplants despite using similar methods. These bulk transcriptomic findings are now applied clinically to assess rejection in biopsies (2, 3, 15), and to support clinical trials of potential new therapies such as anti-CD38 for ABMR (16, 17).
Bulk transcriptomics does not identify the specific leukocyte populations underlying transplant rejection states — information that could be useful in the search for mechanisms that could be targeted by new therapies. Single-cell transcriptomics paired with highly specific cellular labeling and isolation technologies has the potential to provide insights into disease-specific leukocyte states and has mapped a clonally expanded CD8+ T cell population in TCMR (18) and clonally expanded B cells and plasma cells, compatible with a role for B cells as antigen-presenting cells in the TCMR inflammation process (19). Nevertheless, single-cell transcriptomics is limited in the number of biopsies that can be analyzed and is not applicable to large populations (20), making statistical analysis challenging, and may miss rare leukocyte classes of special interest, such as CD4+ memory T cells recently shown in mice to be critical for allorecognition (21).
To augment both single-cell and bulk transcriptomics studies, digital cytometry can be applied to estimate cellular composition or enrichment in tissues assessed by bulk transcriptomics using gene expression patterns derived from isolated cells (e.g., by flow cytometry or single cell transcriptomics workflows). A potential application of digital cytometry is to map digital leukocyte entities (DLEs) associated with rejection in all organ transplants, as well those selective for specific organs. This offers the possibility of examining shared cellular elements in large cohorts of allograft biopsies and provides additional endpoints for clinical trials and potential cellular targets for intervention.
The present study explored the DLEs associated with TCMR and ABMR in large cohorts of kidney (2), heart (3), lung (13), and liver (14) allograft biopsies preserved in RNAlater (Figure 1). To discover the DLEs most specific for TCMR and ABMR, we excluded mixed and ambiguous cases. We assessed multiple cellular references (22–26) using CIBERSORTx (26–28) and compared their alignment with molecular TCMR and ABMR (26–28), and chose the LM22 reference because it was best aligned with rejection diagnoses and profiled the most extensive variety of DLEs (Supplemental Tables 1 and 2; supplemental material available online with this article; https://doi.org/10.1172/JCI208686DS1). Our rationale was that as a blood-based, tissue-agnostic, leukocyte reference, LM22 could profile the DLEs shared by rejection in all organ transplants, setting the stage for ultimately identifying the actual leukocytes and activation states in vivo that underlie these important disease processes. To partially validate the digital associations with TCMR and ABMR in the kidney, we collated publicly available kidney and liver allograft single-cell/nucleus RNA-seq (scsnRNA-seq) data with our own snRNA-seq cohort. Finally, we examined the evolution of the DLEs with standard-of-care (SOC) treatment and their association with risk of graft loss.

-
Results
Kidney, heart, lung, and liver allograft biopsies were classified by their published automated rejection archetype diagnosis assigned by MMDx (4, 5, 13, 14) and locally assigned histology diagnoses. For ease of interpretation, and to focus our analyses on the most distinct and clinically relevant rejection states, molecular rejection classes were simplified to no rejection (NR), TCMR, and in kidney and heart transplants, ABMR. We also assessed histologically normal native kidney tissue from surgical nephrectomies for cancer (“native kidney”), acknowledging that these samples have aging and potentially other molecular abnormalities and should not be considered “normal” kidney tissue. We could not compare heart, lung, and liver transplants to native, untransplanted tissue from those organs due to the lack of suitably preserved tissue.
Alignment of cellular references with rejection diagnoses. Digital leukocyte composition was estimated by CIBERSORTx (26, 28) using the blood-based LM22 (26) and ImmunoStates references (13), as well as kidney-specific KTB18 (25), heart-specific Heart Cell Atlas (HCAv2) (23), lung-specific Human Lung Cell Atlas (HLCAv1.0) (22), and the liver-specific Liver Cell Atlas (LCA) references (Supplemental Table 1).The alignments of each reference with rejection diagnoses were compared using Silhouette scores (29), PERMANOVA r2, and reference principal component score associations with diagnoses (see Supplemental Methods for details). For each organ, the relevant metrics were then simplified as a composite score for ease of interpretation. LM22 had superior alignment with kidney, heart, and lung rejection diagnoses, and liver was not significantly different to ImmunoStates and the liver atlas (Supplemental Figure 1). The superior alignment of LM22 with MMDx rejection diagnoses is likely because transplant rejection is primarily associated with infiltration by leukocytes from blood in various activation states. However, all of these references offer unique perspectives and will be analyzed in detail in future studies, specifically regarding tissue-resident leukocytes and parenchymal cell injury.
Assigning an estimated leukocyte burden to each biopsy. To interpret digital leukocyte composition in light of the total leukocyte infiltrate among rejection groups, we used the expression of the pan-leukocyte gene CD45 (PTPRC) to define an estimated leukocyte burden (ELB) (CD45ELB) in each biopsy (30). We later use CD45ELB to estimate pseudoabundance scores to adjust CIBERSORTx estimates for the total leukocyte infiltrate in each biopsy.
Compared with native kidney tissue, kidney transplant biopsies with no molecular rejection or injury had a 2.7-fold increase in CD45ELB (Table 1). When we included biopsies with molecular injury signals in the no-rejection group, the CD45ELB was 4.19-fold higher than in native kidney tissue. The CD45ELB estimates in heart, lung, and liver transplant biopsies classified as NR were similar to those in kidney biopsies with NR. The increased leukocyte burden in transplants diagnosed as NR compared with native kidney tissue presumably reflects injury-induced inflammation (31, 32), although some may reflect subthreshold alloimmune activity (31).
Biopsies with rejection had an increased leukocyte burden compared with biopsies with NR (Table 1). CD45ELB was 5.8-fold higher in kidneys with TCMR (24-fold higher than native kidney); 6.8-fold higher in hearts with TCMR versus NR; 2.1-fold higher in lungs with TCMR, and 2.7-fold higher in livers with TCMR. CD45ELB was higher in ABMR versus NR: 2.5-fold in kidney ABMR (10.1-fold higher than native kidney tissue) and 3.4-fold higher in heart ABMR.
All biopsies were performed as SOC, and the distribution of biopsies over time for each organ transplant reflected organ-specific biopsy practices (Figure 2A). The leukocyte burden was increased in all transplant biopsies but was independent of time of biopsy after transplant (Figure 2B). The increased leukocyte burden in TCMR and ABMR versus NR in kidney (Figure 2C) and heart (Figure 2D) transplants, and in TCMR versus NR in lung (Figure 2E) and liver (Figure 2F) transplants, was also relatively independent of time after transplant.
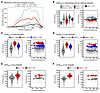 Figure 2
Distribution of biopsies and estimated leukocyte burden. (A) Curves depict kernel density estimates of the distribution of biopsies after transplant for kidney, heart, lung, and liver allograft populations. (B) estimated leukocyte burdens (CD45ELB) and time courses in normal kidney tissue and nonrejecting kidney, heart, lung, and liver allograft tissue. Expression values from microarray analyses (Affymetrix) are robust multiarray average (RMA)-normalized luminosity and are arbitrary. Colored blobs in violin plots depict the distribution of CD45ELB for each group. Solid black circles in violin plots denote the mean CD45ELB for each group. Small transparent circles in time series plots depict CD45ELB in individual biopsies. Large colored circles depict binned CD45 expression using the binscatter method. Curves depict a polynomial fit of CD45ELB. (C–F) estimated leukocyte burdens and time courses in kidney, heart, lung, and liver allograft tissue by molecular diagnoses of T cell–mediated and antibody-mediated rejection. Colored blobs in violin plots depict the distribution of CD45ELB for each group. Solid black circles in violin plots denote the mean CD45ELB for each group. Small transparent circles in time series plots depict CD45ELB in individual biopsies. Large colored circles depict binned CD45ELB using the binscatter method. Curves depict a polynomial fit of CD45ELB.
The composition of digital leukocytes in transplant biopsies compared with native kidney tissue. We designated the DLEs with a lower case “d” (e.g., “dCD4ma”) to distinguish them from actual leukocytes named in vitro. A complete list of cell types profiled by LM22 is provided in Supplemental Table 2. The 5 most abundant DLEs in the native kidney tissue were those designated as activated NK cells (dNKa), alternatively activated macrophages (dM2aa), CD8+ T cells (dCD8), regulatory T cells (dTreg), and naive B cells (dBn), together comprising 73% percent of all DLEs. Note the low percent dTreg in lungs. Despite the increased leukocyte burden in transplants versus native kidney tissue, these 5 DLEs continued to constitute much of the DLE population in nonrejecting transplant biopsies: kidney 63%, heart 68%, lung 47%, and liver 70% (Table 2). Thus, when the leukocyte burden increases, some elements of the DLE hierarchy are preserved.
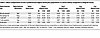 Table 2
Mean compositions of the 5 predominant digital leukocytes populations in native kidney compared to allograft tissue.
The composition of digital leukocytes in kidney transplant biopsies with TCMR or ABMR. Compared with no rejection, both TCMR and ABMR displayed a percent increase in classically activated macrophages (dM1ca) and activated mast cells (dMCa), and a percent decrease in dTreg, activated dendritic cells (dDCa), and resting mast cells (dMCr) (Figure 3A).
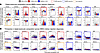 Figure 3
Composition and longitudinal changes in digital leukocytes in kidney transplant biopsies. Digital leukocyte composition was estimated using the CIBERSORTx algorithm and LM22 signature matrix. (A) Group-wise comparisons are illustrated as violin plots. Black circles in violin plots depict the mean percent composition by group. Compositional differences in digital leukocytes among rejection groups was analyzed using Bayes moderated t tests with arcsin-transformed proportions. Letters at the top of the plot depict a compact letter display of all-pairwise post hoc testing, where groups that share the same letter(s) are not different from one another. (B) Time series of estimate leukocytes posttransplant. Small transparent circles depict estimated leukocyte percentages in individual biopsies. Large colored circles depict binned estimated leukocyte percentages using the binscatter method. Curves depict a polynomial fit of estimated leukocyte percentages.
The most striking feature of the digital leukocyte landscape of kidney TCMR was a percent increase in dCD4ma, dCD4Tfh, dTγδ, dCD8, and to a lesser extent dCDn. Memory B cells (dBm), plasma cells (dPC), dMCa, and eosinophils (dEosin) were also increased in TCMR. The percentages of NK cells (resting dNKr and activated dNKa), resting memory CD4 (dCD4mr), resting mast cells (dMCr), and dTreg were decreased in TCMR.
Kidney ABMR was associated with a percent increase in dNKa, monocytes (dMono), and resting DC (dDCr), as well as the panrejection dMCa and M1ca.
The percent of each DLE in kidney rejection was relatively unaffected by time after transplant (Figure 3B). However, in TCMR, the percent of dCD4ma was highest in biopsies 1- to 3-years after transplant, whereas dTγδ was highest in biopsies at later times after transplant. Later TCMR biopsies also had more dBm, dPC, and dMCr. The digital landscape of kidney ABMR showed little relationship to time of biopsy after transplant.
The DLEs associated with the Banff histology rejection diagnoses were like those in the molecular rejection groups (Supplemental Figure 2A), including changes with time after transplant. The dCD4ma were highest early after transplant, whereas dTγδ, dBm, and dPC were increased in late TCMR (Supplemental Figure 2B).
Effect of SOC treatment on digital leukocyte composition. Among the kidney transplants with TCMR in their first biopsy (biopsy 1), 84 had a follow-up biopsy (biopsy 2) after SOC treatment after a mean interval of 64 days. SOC treatment varied but always included high dose glucocorticosteroids. Compared with biopsy 1, the mean TCMR activity score was greatly reduced in biopsy 2, from 0.45 to 0.16 (P < 0.0001). SOC management resulted in a lower composition of all DLEs increased in TCMR (i.e., dCD4ma, dCD4Tfh, dTγδ, and dCD8, as well as dM1ca, dEosin), and an increase in DLEs decreased in TCMR (i.e., dMCr, dTreg, dNKa, and dM2aa), demonstrating that SOC management of TCMR was associated with at least partial suppression of TCMR molecular activity and reversal of the main DLE features of TCMR.
At present, only anti-CD38 monoclonals have been demonstrated to be effective in lowering histologic and molecular ABMR activity in randomized controlled trials (16, 33, 34). No anti-CD38 treatments were part of SOC treatment for ABMR in our cohort during the period in which these biopsies were collected, and the follow-up biopsies showed minimal decrease in digital leukocytes associated with all rejection and ABMR (data not shown).
The composition of digital leukocytes in heart transplant biopsies with TCMR and ABMR. The digital landscapes of heart transplant TCMR and ABMR were very similar to those in kidney transplants. All rejection showed an increase in dM1ca and dMCa. TCMR displayed an increased percent of the dCD4ma, dCD4Tfh, and dTγδ DLEs (Figure 4A). Heart ABMR was also like kidney ABMR, with an increased percentage of dMCa, dNKa, and dMono. As in kidney TCMR, the dCD4ma and dTγδ DLEs in heart TCMR changed with time post-transplant, with dCD4ma higher early post-transplant and dTγδ higher late post-transplant (Figure 4B).
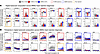 Figure 4
Composition and longitudinal changes in digital leukocytes heart transplant biopsies. Leukocyte profiles were estimated using the CIBERSORTx algorithm and LM22 signature matrix. (A) Group-wise comparisons are illustrated as violin plots. Black circles in violin plots depict the mean percentage composition by group. Compositional differences in digital leukocytes among rejection groups was analyzed using Bayes moderated t tests with arcsin-transformed proportions. Letters at the top of the plot depict a compact letter display of all-pairwise post hoc testing, where groups that share the same letter(s) are not different from one another. (B) Time series of estimate leukocytes after transplant. Small transparent circles depict estimated leukocyte percentages in individual biopsies. Large colored circles depict binned estimated leukocyte percentages using the binscatter method. Curves depict a polynomial fit of estimated leukocyte percentages.
The DLEs associated with ISHLT histologic TCMR and ABMR diagnoses were like those in the molecular rejection groups (Supplemental Figure 3A) with the TCMR relationships being most robust (i.e., dCD4ma, dCD4Tfh, dTγδ; Supplemental Figure 3B).
Digital leukocyte composition in lung and liver transplant biopsies with TCMR. In lung (Figure 5) and liver transplants (Figure 6), TCMR displayed increased panrejection changes (i.e., dM1ca) plus TCMR-selective changes (e.g., increased dCD4ma and dTγδ) similar to those in kidney and heart transplants with TCMR.
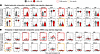 Figure 5
Composition and longitudinal changes in digital leukocyte lung transplant transbronchial biopsies. Leukocyte profiles were estimated using the CIBERSORTx algorithm and LM22 signature matrix. (A) Group-wise comparisons are illustrated as violin plots. Black circles in violin plots depict the mean percent composition by group. Compositional differences in digital leukocytes among rejection groups was analyzed using Bayes moderated t tests with arcsin-transformed proportions. Letters at the top of the plot depict a compact letter display of all-pairwise post-hoc testing, where groups that share the same letter(s) are not different from one another. (B) Time series of estimate leukocytes after transplant. Small transparent circles depict estimated leukocyte percentages in individual biopsies. Large colored circles depict binned estimated leukocyte percentages using the binscatter method. Curves depict a polynomial fit of estimated leukocyte percentages.
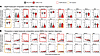 Figure 6
Composition and longitudinal changes in digital leukocytes liver transplant biopsies. Leukocyte profiles were estimated using the CIBERSORTx algorithm and LM22 signature matrix. (A) Group-wise comparisons are illustrated as violin plots. Black circles in violin plots depict the mean percent composition by group. Compositional differences in digital leukocytes among rejection groups was analyzed using Bayes moderated t tests with arcsin-transformed proportions. Letters at the top of the plot depict a compact letter display of all-pairwise post hoc testing, where groups that share the same letter(s) are not different from one another. (B) Time series of estimate leukocytes post-transplant. Small transparent circles depict estimated leukocyte percentages in individual biopsies. Large colored circles depict binned estimated leukocyte percentages using the binscatter method. Curves depict a polynomial fit of estimated leukocyte percentages.
We also compared DLE relationships among histologic lung and liver diagnoses. For lungs, we compared LM22 estimates among ISHLT-A grade (i.e., acute cellular rejection grade). The DLE profile for ISHLT-A grades A3 and A4 (i.e., most intense acute cellular rejection) was like molecular TCMR (Supplemental Figure 4). The DLE profiles in liver had the weakest discrimination for TCMR across organs (discussed below), and this was also seen for histologic TCMR in liver. Nonetheless, the overall trends in hierarchy of DLE selective for molecular and histologic TCMR were similar, although often not significant when comparing histologic NR and TCMR (Supplemental Figure 5). For a more detailed description of the digital leukocyte landscape in lung and liver see the Supplemental Materials.
scsnRNA-seq data support some digital leukocyte associations with rejection. To support our digital findings, we annotated LM22 cell types to scsnRNA-seq data from 4 kidney cohorts and 1 liver cohort and compared resulting cell type compositions among rejection groups. We were unable to do this for heart and lung allografts, as there are no publicly available scsnRNA-seq data for these organs with diagnoses of rejection. For kidney, we integrated our own snRNA-seq cohort of 8 kidney allograft samples from 6 patients diagnosed with TCMR with publicly available scsnRNA-seq data from 3 independent cohorts of kidney transplant biopsies (BioStudies accession code E-MTAB-12051; GEO accession code: GSE195718; GEO accession code: GSE284742) (25, 35, 36) from patients diagnosed with NR, TCMR, and ABMR. After quality control, the combined kidney cohort included 15 NR, 6 TCMR, and 3 ABMR. For liver, we processed an independent cohort of liver allografts from patients diagnosed with NR and TCMR (GEO accession code: GSE256141). After quality control, the liver cohort included 3 NR and 14 TCMR. LM22 labels were assigned to leukocyte subsets using the SingleR algorithm (37).
The leukocyte profile for kidney TCMR and ABMR showed enrichment of M1ca in both TCMR and ABMR (i.e., all rejection), of CD4ma and CD4Tfh in TCMR, and of NKa in ABMR (Supplemental Figure 6, D and E). However, leukocytes corresponding with several DLEs could not be resolved convincingly by SingleR in the kidney cohort, including Tγδ, Tregs, dendritic cells, and mast cells. For liver, CD4ma were the only leukocytes associated with TCMR (Supplemental Figure 6I), with all others failing to meet statistical significance. The overall pattern in leukocytes correlated with liver TCMR versus NR were nonetheless supportive of the digital findings (Supplemental Figure 6J).
A conserved digital leukocyte landscape of TCMR in all organs. dCD4ma, dCD4Tfh, dTγδ, and dCD8 were associated with TCMR in all organs, as well as the pan-rejection dM1ca (Figure 7, A–D). Clustering of rank biserial correlations (rbcor) profiles showed strong selectivity of dCD4ma for TCMR in all organs (Figure 7E). The Spearman correlations of various DLE with TCMR archetype scores were also similar in all organs (Supplemental Table 3). Ranked based on the highest correlations with TCMR diagnosis across all organs, the top 6 DLEs positively correlated with TCMR were dCD4ma, dCD4Tfh, dTγδ, dCD8, dEosin (not in liver), and dPC, as well as the pan-rejection dM1ca. MCa and MCr showed variable TCMR associations.
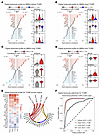 Figure 7
Conserved cross-organ digital leukocyte profile in transplants with T cell–mediated rejection. Digital leukocyte profiles were estimated using the CIBERSORTx algorithm and LM22 signature matrix. (A–D) Rank biserial correlations (lower x-axis) and P-values (upper x-axis) for 22 leukocytes for T cell–mediated rejection (TCMR) versus all other rejection states in kidney (A), heart (B), lung (C), and liver (D) transplant biopsies. Group-wise comparisons of the top 3 positively correlated cell types with TCMR are illustrated as violin plots. Black circles in violin plots depict the mean percent composition by group. Compositional differences in digital leukocytes among rejection groups was analyzed using Bayes moderated t tests with arcsin-transformed proportions. Letters at the top of the plot depict a compact letter display of all-pairwise post hoc testing, where groups that share the same letter(s) are not different from one another. (E) Clustering leukocyte correlation profiles shows the strong selectivity of CD4ma for TCMR in all organs. A correlation network illustrates positive edges for each cell type with TCMR states in each organ. (F) The performance of leukocyte profiles in predicting TCMR was assessed using 10-fold cross-validated generalized linear model with LASSO penalization. Estimated leukocyte profiles performed very well in predicting TCMR in kidney, heart, and lung, but only modestly in liver.
The DLE with the largest CD45ELB-adjusted fold-changes (AFC) in TCMR was dCD4ma: kidney (55.4-fold), heart (53.8-fold), lung (28.3-fold), and liver transplants (30.5-fold) (Supplemental Table 4). The dTγδ also had large AFCs in TCMR versus NR in kidney (28.3-fold), heart (18.8-fold), and lung (25.8-fold), with a comparatively smaller AFC in liver transplants (5.1-fold). CD4Tfh was also increased in TCMR in kidney (9.9-fold), heart (8.8-fold), lung (4.4-fold), and liver (2.9-fold). dEosin, although rare, were increased in TCMR in kidneys, hearts, and lungs, consistent with earlier histology reports (38, 39).
To demonstrate the selectivity of the LM22 DLE profile for TCMR, we used percent DLEs to train a molecular classifier (trained on the molecular diagnoses) to predict the TCMR diagnoses. This predicted TCMR with high performance in all biopsy populations, with cross-validated area-under-the-receiver operator curves (AUCs) of 0.97 in kidney, 0.98 in heart, 0.96 in lung, and 0.81 in liver (Figure 7F).
Table 4 summarizes the percentage, adjusted fold-change, correlation with TCMR diagnoses, and correlation with TCMR archetype score for various T cell and DC DLEs. Although among the lowest percentages, dCD4ma had a high adjusted fold-change and correlations with TCMR, whereas dTreg correlated negatively with TCMR in kidney, heart, and liver transplants (although not in lung transplants, where the baseline percent dTreg was much lower). However, dTreg in TCMR had a weakly positive adjusted fold-change compared with NR, suggesting that the decreased percentage represents dilution (see discussion).
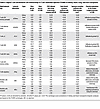 Table 4
Digital T cell and dendritic cell relationships in T cell–mediated rejection (TCMR) in kidney, heart, lung, and liver transplants
The most selective digital leukocytes for ABMR in kidney and heart transplants. dM1ca, dMCa, dNKa, and dMono all had high correlations with ABMR (Figure 8, A–C). These DLE also had high correlations with ABMR archetype scores (Supplemental Table 5). The strongest negative correlations were with dMCr and dTreg. The DLE most increased in ABMR by fold-change were dMCa (Supplemental Table 6).
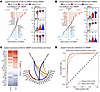 Figure 8
Conserved cross-organ digital leukocyte profile in kidney and heart transplants with antibody-mediated rejection. Digital leukocyte profiles were estimated using the CIBERSORTx algorithm and LM22 signature matrix. (A and B) Rank biserial correlations (lower x-axis) and P-values (upper x-axis) for 22 leukocytes for antibody-mediated rejection (ABMR) versus all other rejection states in kidney (A) and heart (B) transplant biopsies. Group-wise comparisons of the top 3 positively correlated leukocyte types with ABMR are illustrated as violin plots. Black circles in violin plots depict the mean percent composition by group. Compositional differences in digital leukocytes among rejection groups was analyzed using Bayes moderated t tests with arcsin-transformed proportions. Letters at the top of the plot depict a compact letter display of all-pairwise post hoc testing, where groups that share the same letter(s) are not different from one another. (C) Clustering of leukocyte correlations profiles shows the strong selectivity of MCa, M1ca, Mono0, and NKa for ABMR in kidney and heart. A correlation network illustrates positive edges for each leukocyte type with ABMR states in each organ. (D) The performance of leukocyte profiles in predicting ABMR was assessed using 10-fold cross-validated generalized linear model with LASSO penalization. Estimated leukocyte profiles performed very well in predicting ABMR in kidney and heart.
Note that, although they did not correlate with ABMR, TCMR-related T cells (dCD4ma, dTγδ, dCD4Tfh, dCD8) were increased by adjusted fold-change in ABMR about as much as the expansion of the leukocyte burden.
As with TCMR, the DLE profiles strongly predicted ABMR in the biopsy populations, with AUCs of 0.93 in kidney and 0.92 in heart (Figure 8D).
Table 5 compares the percentage, fold-changes and correlations with kidney and heart ABMR for digital leukocytes representing mast cells, dNKa, and dendritic cells. The fold-change and correlations of dMCa, dNKa, and dDCr were increased in ABMR, whereas those for dMCr, dNKr, and dDCa were decreased.
Digital leukocytes common to all rejection. We characterized the correlations of DLE in NR versus all rejection (including possible rejection) in kidney and heart transplants as an estimate of the pan-rejection changes (Figure 9, A–C). The DLEs most correlated with all rejection were dM1ca and dMCa. Conversely, the DLEs anticorrelated with rejection were dMCr and dTreg. As with TCMR and ABMR, the DLE profiles strongly predicted all rejection in the biopsy populations, with AUCs of 0.95 in kidney and 0.98 in heart (Figure 9D).
 Figure 9
Conserved cross-organ digital leukocyte profile in kidney and heart transplants with all rejection. Leukocyte profiles were estimated using the CIBERSORTx algorithm and LM22 signature matrix. (A and B) Rank biserial correlations (lower x-axis) and P values (upper x-axis) for 22 leukocytes for no rejection (NR) versus all other rejection states in kidney (A) and heart (B) transplant biopsies. Group-wise comparisons of the top 3 positively correlated leukocyte types with NR are illustrated as violin plots. Black circles in violin plots depict the mean percentage composition by group. Compositional differences in digital leukocytes among rejection groups was analyzed using Bayes moderated t tests with arcsin-transformed proportions. Letters at the top of the plot depict a compact letter display of all-pairwise post hoc testing, where groups that share the same letter(s) are not different from one another. (C) Clustering of leukocyte correlation profiles shows the strong selectivity of MCr, Treg, M2aa, and Bn for NR in all organs. A correlation network illustrates positive edges for each leukocyte type with NR states in each organ. (D) The performance of leukocyte profiles in predicting NR was assessed using a 10-fold cross-validated generalized linear model with LASSO penalization. Estimated leukocyte profiles performed very well in predicting NR in kidney, heart, and lung, but only modestly in liver. AR, all rejection.
Kidney allograft survival is associated with the molecular rejection states predicted by digital leukocyte composition. We compared Kaplan-Meier estimates of 3-year postbiopsy kidney graft loss stratified by MMDx rejection groups to survival in rejection groups predicted using LM22 composition (Figure 10, A and B). Median follow-up time within the survival cohort was 539 days. Rejection diagnosed by the LM22-based classifier provided slightly stronger associations with graft loss compared with the MMDx diagnoses, indicating that reclassification assisted by digital cytometry estimates improved estimates of survival in our cohort.
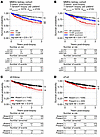 Figure 10
Association of digital leukocytes with graft loss in kidney allografts. Kaplan-Meier curves for kidney allograft survival 3 years after biopsy stratified by MMDx rejection diagnoses (A) and predicted molecular rejection diagnoses using cross-validated machine learning trained on MMDx rejection diagnoses using digital leukocyte composition as features (B). Kaplan-Meier curves for kidney allograft survival 3 years after biopsy stratified by the presence/absence of (C) digital activated memory CD4+ T cells (dCD4ma) and (D) dTγδ. Overall significance in survival predictions by strata were assessed using a long-rank test. Pairwise differences are represented by a lettering on the right-hand side of each plot, where groups that share the same letter(s) are not different from one another.
We then studied how well DLE measurements alone (i.e., independent of rejection diagnoses) were able to predict graft loss. We trained a 10-fold cross-validated random survival forest using LM22 composition as features, which produced poor performance (C-indexkidney = 0.66; C-indexheart = 0.68; C-indexlung = 0.67), indicating that DLE composition alone provides limited value for predicting graft loss postbiopsy. Thus, the DLEs predicted the disease states associated with survival, but survival estimates based on DLE composition alone did not strongly predict survival, which is expected given that postbiopsy survival is dictated primarily by parenchymal injury, even within the rejection states (40, 41).
Because of the strong association between the rare dCD4ma and dTγδ with TCMR, we specifically explored the associations of these individual DLEs by stratifying them as present or absent, and found the presence of dCD4ma and dTγδ was associated with poorer outcome (Figure 10, C and D).


Copyright © 2026 American Society for Clinical Investigation
ISSN: 0021-9738 (print), 1558-8238 (online)