
Advertisement
Research ArticleImmunologyMuscle biologyNeuroscience
Open Access |  10.1172/JCI203540
Immune cell–specific SMN expression and sustained immune alterations in treated spinal muscular atrophy
Ines Tapken,1,2,3,4 Katharina Rahmel-Stein,1,5 Christine Ehlers,1,6 Federica Cieri,7,8 Nora T. Detering,9 Tobias Schüning,9 Bogdan Bjelica,10,11 Charlotte Mindermann,12 Svenja Neuhoff,13 Linda-Isabell Schmitt,13 Markus Leo,13 Tim Hagenacker,13 Sabine Illsinger,12 Elia Di Schiavi,7 Theresa Graalmann,1,6,14 Susanne Petri,11,15 Ulrich Kalinke,1,4 and Peter Claus8,16
1TWINCORE–Centre for Experimental and Clinical Infection Research, a joint venture between the Hannover Medical School and the Helmholtz Centre for Infection Research, Hannover, Germany.
2Centre for Individualised Infection Medicine (CiiM), a joint venture between the Helmholtz Centre for Infection Research and Hannover Medical School, Hannover, Germany.
3Department of Gastroenterology, Hepatology, Infectious Diseases and Endocrinology, and
4Cluster of Excellence RESIST (EXC 2155), Hannover Medical School, Hannover, Germany.
5Hannover Biomedical Research School (HBRS) and Center for Infection Biology (ZIB), Hannover, Germany.
6Biomedical Research in End-Stage and Obstructive Lung Disease Hannover (BREATH), German Center for Lung Research (DZL), Hannover, Germany.
7Institute of Biosciences and BioResources, National Research Council (CNR), Naples, Italy.
8Department of Biology, University of Naples Federico II, Naples, Italy.
9Center for Systems Neuroscience (ZSN), Hannover, Germany.
10PRACTIS Clinician Scientist Program, Dean’s Office for Academic Career Development, and
11Department of Neurology and Clinical Neurophysiology, Hannover Medical School, Hannover, Germany
12Clinic for Pediatric Kidney, Liver, Metabolic, and Neurological Diseases, Hannover Medical School, Hannover, Germany.
13Department of Neurology, Center for Translational Neuro- and Behavioral Sciences (C-TNBS), University Medicine Essen, Essen, Germany.
14Department of Rheumatology and Immunology, Hannover Medical School, Hannover, Germany.
15DIAKOVERE Henriettenstift, Clinic for Neurology and Clinical Neurophysiology, Hannover, Germany.
16Laboratory of Molecular Neurosciences, Department of Psychiatry, Social Psychiatry and Psychotherapy, Hannover Medical School, Hannover, Germany.
Address for correspondence. Peter Claus, Hannover Medical School, Laboratory of Molecular Neurosciences, Feodor-Lynen-Str. 35, 30625 Hannover, Germany. Phone: 49.511.532.7275; Email: claus.peter@mh-hannover.de.
Authorship note: IT and KRS are co–first authors and contributed equally to this work. UK and PC are co-senior authors.
Find articles by Tapken, I. in: PubMed | Google Scholar
1TWINCORE–Centre for Experimental and Clinical Infection Research, a joint venture between the Hannover Medical School and the Helmholtz Centre for Infection Research, Hannover, Germany.
2Centre for Individualised Infection Medicine (CiiM), a joint venture between the Helmholtz Centre for Infection Research and Hannover Medical School, Hannover, Germany.
3Department of Gastroenterology, Hepatology, Infectious Diseases and Endocrinology, and
4Cluster of Excellence RESIST (EXC 2155), Hannover Medical School, Hannover, Germany.
5Hannover Biomedical Research School (HBRS) and Center for Infection Biology (ZIB), Hannover, Germany.
6Biomedical Research in End-Stage and Obstructive Lung Disease Hannover (BREATH), German Center for Lung Research (DZL), Hannover, Germany.
7Institute of Biosciences and BioResources, National Research Council (CNR), Naples, Italy.
8Department of Biology, University of Naples Federico II, Naples, Italy.
9Center for Systems Neuroscience (ZSN), Hannover, Germany.
10PRACTIS Clinician Scientist Program, Dean’s Office for Academic Career Development, and
11Department of Neurology and Clinical Neurophysiology, Hannover Medical School, Hannover, Germany
12Clinic for Pediatric Kidney, Liver, Metabolic, and Neurological Diseases, Hannover Medical School, Hannover, Germany.
13Department of Neurology, Center for Translational Neuro- and Behavioral Sciences (C-TNBS), University Medicine Essen, Essen, Germany.
14Department of Rheumatology and Immunology, Hannover Medical School, Hannover, Germany.
15DIAKOVERE Henriettenstift, Clinic for Neurology and Clinical Neurophysiology, Hannover, Germany.
16Laboratory of Molecular Neurosciences, Department of Psychiatry, Social Psychiatry and Psychotherapy, Hannover Medical School, Hannover, Germany.
Address for correspondence. Peter Claus, Hannover Medical School, Laboratory of Molecular Neurosciences, Feodor-Lynen-Str. 35, 30625 Hannover, Germany. Phone: 49.511.532.7275; Email: claus.peter@mh-hannover.de.
Authorship note: IT and KRS are co–first authors and contributed equally to this work. UK and PC are co-senior authors.
Find articles by Rahmel-Stein, K. in: PubMed | Google Scholar
1TWINCORE–Centre for Experimental and Clinical Infection Research, a joint venture between the Hannover Medical School and the Helmholtz Centre for Infection Research, Hannover, Germany.
2Centre for Individualised Infection Medicine (CiiM), a joint venture between the Helmholtz Centre for Infection Research and Hannover Medical School, Hannover, Germany.
3Department of Gastroenterology, Hepatology, Infectious Diseases and Endocrinology, and
4Cluster of Excellence RESIST (EXC 2155), Hannover Medical School, Hannover, Germany.
5Hannover Biomedical Research School (HBRS) and Center for Infection Biology (ZIB), Hannover, Germany.
6Biomedical Research in End-Stage and Obstructive Lung Disease Hannover (BREATH), German Center for Lung Research (DZL), Hannover, Germany.
7Institute of Biosciences and BioResources, National Research Council (CNR), Naples, Italy.
8Department of Biology, University of Naples Federico II, Naples, Italy.
9Center for Systems Neuroscience (ZSN), Hannover, Germany.
10PRACTIS Clinician Scientist Program, Dean’s Office for Academic Career Development, and
11Department of Neurology and Clinical Neurophysiology, Hannover Medical School, Hannover, Germany
12Clinic for Pediatric Kidney, Liver, Metabolic, and Neurological Diseases, Hannover Medical School, Hannover, Germany.
13Department of Neurology, Center for Translational Neuro- and Behavioral Sciences (C-TNBS), University Medicine Essen, Essen, Germany.
14Department of Rheumatology and Immunology, Hannover Medical School, Hannover, Germany.
15DIAKOVERE Henriettenstift, Clinic for Neurology and Clinical Neurophysiology, Hannover, Germany.
16Laboratory of Molecular Neurosciences, Department of Psychiatry, Social Psychiatry and Psychotherapy, Hannover Medical School, Hannover, Germany.
Address for correspondence. Peter Claus, Hannover Medical School, Laboratory of Molecular Neurosciences, Feodor-Lynen-Str. 35, 30625 Hannover, Germany. Phone: 49.511.532.7275; Email: claus.peter@mh-hannover.de.
Authorship note: IT and KRS are co–first authors and contributed equally to this work. UK and PC are co-senior authors.
Find articles by Ehlers, C. in: PubMed | Google Scholar
1TWINCORE–Centre for Experimental and Clinical Infection Research, a joint venture between the Hannover Medical School and the Helmholtz Centre for Infection Research, Hannover, Germany.
2Centre for Individualised Infection Medicine (CiiM), a joint venture between the Helmholtz Centre for Infection Research and Hannover Medical School, Hannover, Germany.
3Department of Gastroenterology, Hepatology, Infectious Diseases and Endocrinology, and
4Cluster of Excellence RESIST (EXC 2155), Hannover Medical School, Hannover, Germany.
5Hannover Biomedical Research School (HBRS) and Center for Infection Biology (ZIB), Hannover, Germany.
6Biomedical Research in End-Stage and Obstructive Lung Disease Hannover (BREATH), German Center for Lung Research (DZL), Hannover, Germany.
7Institute of Biosciences and BioResources, National Research Council (CNR), Naples, Italy.
8Department of Biology, University of Naples Federico II, Naples, Italy.
9Center for Systems Neuroscience (ZSN), Hannover, Germany.
10PRACTIS Clinician Scientist Program, Dean’s Office for Academic Career Development, and
11Department of Neurology and Clinical Neurophysiology, Hannover Medical School, Hannover, Germany
12Clinic for Pediatric Kidney, Liver, Metabolic, and Neurological Diseases, Hannover Medical School, Hannover, Germany.
13Department of Neurology, Center for Translational Neuro- and Behavioral Sciences (C-TNBS), University Medicine Essen, Essen, Germany.
14Department of Rheumatology and Immunology, Hannover Medical School, Hannover, Germany.
15DIAKOVERE Henriettenstift, Clinic for Neurology and Clinical Neurophysiology, Hannover, Germany.
16Laboratory of Molecular Neurosciences, Department of Psychiatry, Social Psychiatry and Psychotherapy, Hannover Medical School, Hannover, Germany.
Address for correspondence. Peter Claus, Hannover Medical School, Laboratory of Molecular Neurosciences, Feodor-Lynen-Str. 35, 30625 Hannover, Germany. Phone: 49.511.532.7275; Email: claus.peter@mh-hannover.de.
Authorship note: IT and KRS are co–first authors and contributed equally to this work. UK and PC are co-senior authors.
Find articles by Cieri, F. in: PubMed | Google Scholar
1TWINCORE–Centre for Experimental and Clinical Infection Research, a joint venture between the Hannover Medical School and the Helmholtz Centre for Infection Research, Hannover, Germany.
2Centre for Individualised Infection Medicine (CiiM), a joint venture between the Helmholtz Centre for Infection Research and Hannover Medical School, Hannover, Germany.
3Department of Gastroenterology, Hepatology, Infectious Diseases and Endocrinology, and
4Cluster of Excellence RESIST (EXC 2155), Hannover Medical School, Hannover, Germany.
5Hannover Biomedical Research School (HBRS) and Center for Infection Biology (ZIB), Hannover, Germany.
6Biomedical Research in End-Stage and Obstructive Lung Disease Hannover (BREATH), German Center for Lung Research (DZL), Hannover, Germany.
7Institute of Biosciences and BioResources, National Research Council (CNR), Naples, Italy.
8Department of Biology, University of Naples Federico II, Naples, Italy.
9Center for Systems Neuroscience (ZSN), Hannover, Germany.
10PRACTIS Clinician Scientist Program, Dean’s Office for Academic Career Development, and
11Department of Neurology and Clinical Neurophysiology, Hannover Medical School, Hannover, Germany
12Clinic for Pediatric Kidney, Liver, Metabolic, and Neurological Diseases, Hannover Medical School, Hannover, Germany.
13Department of Neurology, Center for Translational Neuro- and Behavioral Sciences (C-TNBS), University Medicine Essen, Essen, Germany.
14Department of Rheumatology and Immunology, Hannover Medical School, Hannover, Germany.
15DIAKOVERE Henriettenstift, Clinic for Neurology and Clinical Neurophysiology, Hannover, Germany.
16Laboratory of Molecular Neurosciences, Department of Psychiatry, Social Psychiatry and Psychotherapy, Hannover Medical School, Hannover, Germany.
Address for correspondence. Peter Claus, Hannover Medical School, Laboratory of Molecular Neurosciences, Feodor-Lynen-Str. 35, 30625 Hannover, Germany. Phone: 49.511.532.7275; Email: claus.peter@mh-hannover.de.
Authorship note: IT and KRS are co–first authors and contributed equally to this work. UK and PC are co-senior authors.
Find articles by Detering, N. in: PubMed | Google Scholar
1TWINCORE–Centre for Experimental and Clinical Infection Research, a joint venture between the Hannover Medical School and the Helmholtz Centre for Infection Research, Hannover, Germany.
2Centre for Individualised Infection Medicine (CiiM), a joint venture between the Helmholtz Centre for Infection Research and Hannover Medical School, Hannover, Germany.
3Department of Gastroenterology, Hepatology, Infectious Diseases and Endocrinology, and
4Cluster of Excellence RESIST (EXC 2155), Hannover Medical School, Hannover, Germany.
5Hannover Biomedical Research School (HBRS) and Center for Infection Biology (ZIB), Hannover, Germany.
6Biomedical Research in End-Stage and Obstructive Lung Disease Hannover (BREATH), German Center for Lung Research (DZL), Hannover, Germany.
7Institute of Biosciences and BioResources, National Research Council (CNR), Naples, Italy.
8Department of Biology, University of Naples Federico II, Naples, Italy.
9Center for Systems Neuroscience (ZSN), Hannover, Germany.
10PRACTIS Clinician Scientist Program, Dean’s Office for Academic Career Development, and
11Department of Neurology and Clinical Neurophysiology, Hannover Medical School, Hannover, Germany
12Clinic for Pediatric Kidney, Liver, Metabolic, and Neurological Diseases, Hannover Medical School, Hannover, Germany.
13Department of Neurology, Center for Translational Neuro- and Behavioral Sciences (C-TNBS), University Medicine Essen, Essen, Germany.
14Department of Rheumatology and Immunology, Hannover Medical School, Hannover, Germany.
15DIAKOVERE Henriettenstift, Clinic for Neurology and Clinical Neurophysiology, Hannover, Germany.
16Laboratory of Molecular Neurosciences, Department of Psychiatry, Social Psychiatry and Psychotherapy, Hannover Medical School, Hannover, Germany.
Address for correspondence. Peter Claus, Hannover Medical School, Laboratory of Molecular Neurosciences, Feodor-Lynen-Str. 35, 30625 Hannover, Germany. Phone: 49.511.532.7275; Email: claus.peter@mh-hannover.de.
Authorship note: IT and KRS are co–first authors and contributed equally to this work. UK and PC are co-senior authors.
Find articles by Schüning, T. in: PubMed | Google Scholar
1TWINCORE–Centre for Experimental and Clinical Infection Research, a joint venture between the Hannover Medical School and the Helmholtz Centre for Infection Research, Hannover, Germany.
2Centre for Individualised Infection Medicine (CiiM), a joint venture between the Helmholtz Centre for Infection Research and Hannover Medical School, Hannover, Germany.
3Department of Gastroenterology, Hepatology, Infectious Diseases and Endocrinology, and
4Cluster of Excellence RESIST (EXC 2155), Hannover Medical School, Hannover, Germany.
5Hannover Biomedical Research School (HBRS) and Center for Infection Biology (ZIB), Hannover, Germany.
6Biomedical Research in End-Stage and Obstructive Lung Disease Hannover (BREATH), German Center for Lung Research (DZL), Hannover, Germany.
7Institute of Biosciences and BioResources, National Research Council (CNR), Naples, Italy.
8Department of Biology, University of Naples Federico II, Naples, Italy.
9Center for Systems Neuroscience (ZSN), Hannover, Germany.
10PRACTIS Clinician Scientist Program, Dean’s Office for Academic Career Development, and
11Department of Neurology and Clinical Neurophysiology, Hannover Medical School, Hannover, Germany
12Clinic for Pediatric Kidney, Liver, Metabolic, and Neurological Diseases, Hannover Medical School, Hannover, Germany.
13Department of Neurology, Center for Translational Neuro- and Behavioral Sciences (C-TNBS), University Medicine Essen, Essen, Germany.
14Department of Rheumatology and Immunology, Hannover Medical School, Hannover, Germany.
15DIAKOVERE Henriettenstift, Clinic for Neurology and Clinical Neurophysiology, Hannover, Germany.
16Laboratory of Molecular Neurosciences, Department of Psychiatry, Social Psychiatry and Psychotherapy, Hannover Medical School, Hannover, Germany.
Address for correspondence. Peter Claus, Hannover Medical School, Laboratory of Molecular Neurosciences, Feodor-Lynen-Str. 35, 30625 Hannover, Germany. Phone: 49.511.532.7275; Email: claus.peter@mh-hannover.de.
Authorship note: IT and KRS are co–first authors and contributed equally to this work. UK and PC are co-senior authors.
Find articles by Bjelica, B. in: PubMed | Google Scholar
1TWINCORE–Centre for Experimental and Clinical Infection Research, a joint venture between the Hannover Medical School and the Helmholtz Centre for Infection Research, Hannover, Germany.
2Centre for Individualised Infection Medicine (CiiM), a joint venture between the Helmholtz Centre for Infection Research and Hannover Medical School, Hannover, Germany.
3Department of Gastroenterology, Hepatology, Infectious Diseases and Endocrinology, and
4Cluster of Excellence RESIST (EXC 2155), Hannover Medical School, Hannover, Germany.
5Hannover Biomedical Research School (HBRS) and Center for Infection Biology (ZIB), Hannover, Germany.
6Biomedical Research in End-Stage and Obstructive Lung Disease Hannover (BREATH), German Center for Lung Research (DZL), Hannover, Germany.
7Institute of Biosciences and BioResources, National Research Council (CNR), Naples, Italy.
8Department of Biology, University of Naples Federico II, Naples, Italy.
9Center for Systems Neuroscience (ZSN), Hannover, Germany.
10PRACTIS Clinician Scientist Program, Dean’s Office for Academic Career Development, and
11Department of Neurology and Clinical Neurophysiology, Hannover Medical School, Hannover, Germany
12Clinic for Pediatric Kidney, Liver, Metabolic, and Neurological Diseases, Hannover Medical School, Hannover, Germany.
13Department of Neurology, Center for Translational Neuro- and Behavioral Sciences (C-TNBS), University Medicine Essen, Essen, Germany.
14Department of Rheumatology and Immunology, Hannover Medical School, Hannover, Germany.
15DIAKOVERE Henriettenstift, Clinic for Neurology and Clinical Neurophysiology, Hannover, Germany.
16Laboratory of Molecular Neurosciences, Department of Psychiatry, Social Psychiatry and Psychotherapy, Hannover Medical School, Hannover, Germany.
Address for correspondence. Peter Claus, Hannover Medical School, Laboratory of Molecular Neurosciences, Feodor-Lynen-Str. 35, 30625 Hannover, Germany. Phone: 49.511.532.7275; Email: claus.peter@mh-hannover.de.
Authorship note: IT and KRS are co–first authors and contributed equally to this work. UK and PC are co-senior authors.
Find articles by Mindermann, C. in: PubMed | Google Scholar
1TWINCORE–Centre for Experimental and Clinical Infection Research, a joint venture between the Hannover Medical School and the Helmholtz Centre for Infection Research, Hannover, Germany.
2Centre for Individualised Infection Medicine (CiiM), a joint venture between the Helmholtz Centre for Infection Research and Hannover Medical School, Hannover, Germany.
3Department of Gastroenterology, Hepatology, Infectious Diseases and Endocrinology, and
4Cluster of Excellence RESIST (EXC 2155), Hannover Medical School, Hannover, Germany.
5Hannover Biomedical Research School (HBRS) and Center for Infection Biology (ZIB), Hannover, Germany.
6Biomedical Research in End-Stage and Obstructive Lung Disease Hannover (BREATH), German Center for Lung Research (DZL), Hannover, Germany.
7Institute of Biosciences and BioResources, National Research Council (CNR), Naples, Italy.
8Department of Biology, University of Naples Federico II, Naples, Italy.
9Center for Systems Neuroscience (ZSN), Hannover, Germany.
10PRACTIS Clinician Scientist Program, Dean’s Office for Academic Career Development, and
11Department of Neurology and Clinical Neurophysiology, Hannover Medical School, Hannover, Germany
12Clinic for Pediatric Kidney, Liver, Metabolic, and Neurological Diseases, Hannover Medical School, Hannover, Germany.
13Department of Neurology, Center for Translational Neuro- and Behavioral Sciences (C-TNBS), University Medicine Essen, Essen, Germany.
14Department of Rheumatology and Immunology, Hannover Medical School, Hannover, Germany.
15DIAKOVERE Henriettenstift, Clinic for Neurology and Clinical Neurophysiology, Hannover, Germany.
16Laboratory of Molecular Neurosciences, Department of Psychiatry, Social Psychiatry and Psychotherapy, Hannover Medical School, Hannover, Germany.
Address for correspondence. Peter Claus, Hannover Medical School, Laboratory of Molecular Neurosciences, Feodor-Lynen-Str. 35, 30625 Hannover, Germany. Phone: 49.511.532.7275; Email: claus.peter@mh-hannover.de.
Authorship note: IT and KRS are co–first authors and contributed equally to this work. UK and PC are co-senior authors.
Find articles by Neuhoff, S. in: PubMed | Google Scholar
1TWINCORE–Centre for Experimental and Clinical Infection Research, a joint venture between the Hannover Medical School and the Helmholtz Centre for Infection Research, Hannover, Germany.
2Centre for Individualised Infection Medicine (CiiM), a joint venture between the Helmholtz Centre for Infection Research and Hannover Medical School, Hannover, Germany.
3Department of Gastroenterology, Hepatology, Infectious Diseases and Endocrinology, and
4Cluster of Excellence RESIST (EXC 2155), Hannover Medical School, Hannover, Germany.
5Hannover Biomedical Research School (HBRS) and Center for Infection Biology (ZIB), Hannover, Germany.
6Biomedical Research in End-Stage and Obstructive Lung Disease Hannover (BREATH), German Center for Lung Research (DZL), Hannover, Germany.
7Institute of Biosciences and BioResources, National Research Council (CNR), Naples, Italy.
8Department of Biology, University of Naples Federico II, Naples, Italy.
9Center for Systems Neuroscience (ZSN), Hannover, Germany.
10PRACTIS Clinician Scientist Program, Dean’s Office for Academic Career Development, and
11Department of Neurology and Clinical Neurophysiology, Hannover Medical School, Hannover, Germany
12Clinic for Pediatric Kidney, Liver, Metabolic, and Neurological Diseases, Hannover Medical School, Hannover, Germany.
13Department of Neurology, Center for Translational Neuro- and Behavioral Sciences (C-TNBS), University Medicine Essen, Essen, Germany.
14Department of Rheumatology and Immunology, Hannover Medical School, Hannover, Germany.
15DIAKOVERE Henriettenstift, Clinic for Neurology and Clinical Neurophysiology, Hannover, Germany.
16Laboratory of Molecular Neurosciences, Department of Psychiatry, Social Psychiatry and Psychotherapy, Hannover Medical School, Hannover, Germany.
Address for correspondence. Peter Claus, Hannover Medical School, Laboratory of Molecular Neurosciences, Feodor-Lynen-Str. 35, 30625 Hannover, Germany. Phone: 49.511.532.7275; Email: claus.peter@mh-hannover.de.
Authorship note: IT and KRS are co–first authors and contributed equally to this work. UK and PC are co-senior authors.
Find articles by Schmitt, L. in: PubMed | Google Scholar
1TWINCORE–Centre for Experimental and Clinical Infection Research, a joint venture between the Hannover Medical School and the Helmholtz Centre for Infection Research, Hannover, Germany.
2Centre for Individualised Infection Medicine (CiiM), a joint venture between the Helmholtz Centre for Infection Research and Hannover Medical School, Hannover, Germany.
3Department of Gastroenterology, Hepatology, Infectious Diseases and Endocrinology, and
4Cluster of Excellence RESIST (EXC 2155), Hannover Medical School, Hannover, Germany.
5Hannover Biomedical Research School (HBRS) and Center for Infection Biology (ZIB), Hannover, Germany.
6Biomedical Research in End-Stage and Obstructive Lung Disease Hannover (BREATH), German Center for Lung Research (DZL), Hannover, Germany.
7Institute of Biosciences and BioResources, National Research Council (CNR), Naples, Italy.
8Department of Biology, University of Naples Federico II, Naples, Italy.
9Center for Systems Neuroscience (ZSN), Hannover, Germany.
10PRACTIS Clinician Scientist Program, Dean’s Office for Academic Career Development, and
11Department of Neurology and Clinical Neurophysiology, Hannover Medical School, Hannover, Germany
12Clinic for Pediatric Kidney, Liver, Metabolic, and Neurological Diseases, Hannover Medical School, Hannover, Germany.
13Department of Neurology, Center for Translational Neuro- and Behavioral Sciences (C-TNBS), University Medicine Essen, Essen, Germany.
14Department of Rheumatology and Immunology, Hannover Medical School, Hannover, Germany.
15DIAKOVERE Henriettenstift, Clinic for Neurology and Clinical Neurophysiology, Hannover, Germany.
16Laboratory of Molecular Neurosciences, Department of Psychiatry, Social Psychiatry and Psychotherapy, Hannover Medical School, Hannover, Germany.
Address for correspondence. Peter Claus, Hannover Medical School, Laboratory of Molecular Neurosciences, Feodor-Lynen-Str. 35, 30625 Hannover, Germany. Phone: 49.511.532.7275; Email: claus.peter@mh-hannover.de.
Authorship note: IT and KRS are co–first authors and contributed equally to this work. UK and PC are co-senior authors.
Find articles by Leo, M. in: PubMed | Google Scholar
1TWINCORE–Centre for Experimental and Clinical Infection Research, a joint venture between the Hannover Medical School and the Helmholtz Centre for Infection Research, Hannover, Germany.
2Centre for Individualised Infection Medicine (CiiM), a joint venture between the Helmholtz Centre for Infection Research and Hannover Medical School, Hannover, Germany.
3Department of Gastroenterology, Hepatology, Infectious Diseases and Endocrinology, and
4Cluster of Excellence RESIST (EXC 2155), Hannover Medical School, Hannover, Germany.
5Hannover Biomedical Research School (HBRS) and Center for Infection Biology (ZIB), Hannover, Germany.
6Biomedical Research in End-Stage and Obstructive Lung Disease Hannover (BREATH), German Center for Lung Research (DZL), Hannover, Germany.
7Institute of Biosciences and BioResources, National Research Council (CNR), Naples, Italy.
8Department of Biology, University of Naples Federico II, Naples, Italy.
9Center for Systems Neuroscience (ZSN), Hannover, Germany.
10PRACTIS Clinician Scientist Program, Dean’s Office for Academic Career Development, and
11Department of Neurology and Clinical Neurophysiology, Hannover Medical School, Hannover, Germany
12Clinic for Pediatric Kidney, Liver, Metabolic, and Neurological Diseases, Hannover Medical School, Hannover, Germany.
13Department of Neurology, Center for Translational Neuro- and Behavioral Sciences (C-TNBS), University Medicine Essen, Essen, Germany.
14Department of Rheumatology and Immunology, Hannover Medical School, Hannover, Germany.
15DIAKOVERE Henriettenstift, Clinic for Neurology and Clinical Neurophysiology, Hannover, Germany.
16Laboratory of Molecular Neurosciences, Department of Psychiatry, Social Psychiatry and Psychotherapy, Hannover Medical School, Hannover, Germany.
Address for correspondence. Peter Claus, Hannover Medical School, Laboratory of Molecular Neurosciences, Feodor-Lynen-Str. 35, 30625 Hannover, Germany. Phone: 49.511.532.7275; Email: claus.peter@mh-hannover.de.
Authorship note: IT and KRS are co–first authors and contributed equally to this work. UK and PC are co-senior authors.
Find articles by Hagenacker, T. in: PubMed | Google Scholar
1TWINCORE–Centre for Experimental and Clinical Infection Research, a joint venture between the Hannover Medical School and the Helmholtz Centre for Infection Research, Hannover, Germany.
2Centre for Individualised Infection Medicine (CiiM), a joint venture between the Helmholtz Centre for Infection Research and Hannover Medical School, Hannover, Germany.
3Department of Gastroenterology, Hepatology, Infectious Diseases and Endocrinology, and
4Cluster of Excellence RESIST (EXC 2155), Hannover Medical School, Hannover, Germany.
5Hannover Biomedical Research School (HBRS) and Center for Infection Biology (ZIB), Hannover, Germany.
6Biomedical Research in End-Stage and Obstructive Lung Disease Hannover (BREATH), German Center for Lung Research (DZL), Hannover, Germany.
7Institute of Biosciences and BioResources, National Research Council (CNR), Naples, Italy.
8Department of Biology, University of Naples Federico II, Naples, Italy.
9Center for Systems Neuroscience (ZSN), Hannover, Germany.
10PRACTIS Clinician Scientist Program, Dean’s Office for Academic Career Development, and
11Department of Neurology and Clinical Neurophysiology, Hannover Medical School, Hannover, Germany
12Clinic for Pediatric Kidney, Liver, Metabolic, and Neurological Diseases, Hannover Medical School, Hannover, Germany.
13Department of Neurology, Center for Translational Neuro- and Behavioral Sciences (C-TNBS), University Medicine Essen, Essen, Germany.
14Department of Rheumatology and Immunology, Hannover Medical School, Hannover, Germany.
15DIAKOVERE Henriettenstift, Clinic for Neurology and Clinical Neurophysiology, Hannover, Germany.
16Laboratory of Molecular Neurosciences, Department of Psychiatry, Social Psychiatry and Psychotherapy, Hannover Medical School, Hannover, Germany.
Address for correspondence. Peter Claus, Hannover Medical School, Laboratory of Molecular Neurosciences, Feodor-Lynen-Str. 35, 30625 Hannover, Germany. Phone: 49.511.532.7275; Email: claus.peter@mh-hannover.de.
Authorship note: IT and KRS are co–first authors and contributed equally to this work. UK and PC are co-senior authors.
Find articles by Illsinger, S. in: PubMed | Google Scholar
1TWINCORE–Centre for Experimental and Clinical Infection Research, a joint venture between the Hannover Medical School and the Helmholtz Centre for Infection Research, Hannover, Germany.
2Centre for Individualised Infection Medicine (CiiM), a joint venture between the Helmholtz Centre for Infection Research and Hannover Medical School, Hannover, Germany.
3Department of Gastroenterology, Hepatology, Infectious Diseases and Endocrinology, and
4Cluster of Excellence RESIST (EXC 2155), Hannover Medical School, Hannover, Germany.
5Hannover Biomedical Research School (HBRS) and Center for Infection Biology (ZIB), Hannover, Germany.
6Biomedical Research in End-Stage and Obstructive Lung Disease Hannover (BREATH), German Center for Lung Research (DZL), Hannover, Germany.
7Institute of Biosciences and BioResources, National Research Council (CNR), Naples, Italy.
8Department of Biology, University of Naples Federico II, Naples, Italy.
9Center for Systems Neuroscience (ZSN), Hannover, Germany.
10PRACTIS Clinician Scientist Program, Dean’s Office for Academic Career Development, and
11Department of Neurology and Clinical Neurophysiology, Hannover Medical School, Hannover, Germany
12Clinic for Pediatric Kidney, Liver, Metabolic, and Neurological Diseases, Hannover Medical School, Hannover, Germany.
13Department of Neurology, Center for Translational Neuro- and Behavioral Sciences (C-TNBS), University Medicine Essen, Essen, Germany.
14Department of Rheumatology and Immunology, Hannover Medical School, Hannover, Germany.
15DIAKOVERE Henriettenstift, Clinic for Neurology and Clinical Neurophysiology, Hannover, Germany.
16Laboratory of Molecular Neurosciences, Department of Psychiatry, Social Psychiatry and Psychotherapy, Hannover Medical School, Hannover, Germany.
Address for correspondence. Peter Claus, Hannover Medical School, Laboratory of Molecular Neurosciences, Feodor-Lynen-Str. 35, 30625 Hannover, Germany. Phone: 49.511.532.7275; Email: claus.peter@mh-hannover.de.
Authorship note: IT and KRS are co–first authors and contributed equally to this work. UK and PC are co-senior authors.
Find articles by Di Schiavi, E. in: PubMed | Google Scholar
1TWINCORE–Centre for Experimental and Clinical Infection Research, a joint venture between the Hannover Medical School and the Helmholtz Centre for Infection Research, Hannover, Germany.
2Centre for Individualised Infection Medicine (CiiM), a joint venture between the Helmholtz Centre for Infection Research and Hannover Medical School, Hannover, Germany.
3Department of Gastroenterology, Hepatology, Infectious Diseases and Endocrinology, and
4Cluster of Excellence RESIST (EXC 2155), Hannover Medical School, Hannover, Germany.
5Hannover Biomedical Research School (HBRS) and Center for Infection Biology (ZIB), Hannover, Germany.
6Biomedical Research in End-Stage and Obstructive Lung Disease Hannover (BREATH), German Center for Lung Research (DZL), Hannover, Germany.
7Institute of Biosciences and BioResources, National Research Council (CNR), Naples, Italy.
8Department of Biology, University of Naples Federico II, Naples, Italy.
9Center for Systems Neuroscience (ZSN), Hannover, Germany.
10PRACTIS Clinician Scientist Program, Dean’s Office for Academic Career Development, and
11Department of Neurology and Clinical Neurophysiology, Hannover Medical School, Hannover, Germany
12Clinic for Pediatric Kidney, Liver, Metabolic, and Neurological Diseases, Hannover Medical School, Hannover, Germany.
13Department of Neurology, Center for Translational Neuro- and Behavioral Sciences (C-TNBS), University Medicine Essen, Essen, Germany.
14Department of Rheumatology and Immunology, Hannover Medical School, Hannover, Germany.
15DIAKOVERE Henriettenstift, Clinic for Neurology and Clinical Neurophysiology, Hannover, Germany.
16Laboratory of Molecular Neurosciences, Department of Psychiatry, Social Psychiatry and Psychotherapy, Hannover Medical School, Hannover, Germany.
Address for correspondence. Peter Claus, Hannover Medical School, Laboratory of Molecular Neurosciences, Feodor-Lynen-Str. 35, 30625 Hannover, Germany. Phone: 49.511.532.7275; Email: claus.peter@mh-hannover.de.
Authorship note: IT and KRS are co–first authors and contributed equally to this work. UK and PC are co-senior authors.
Find articles by Graalmann, T. in: PubMed | Google Scholar
1TWINCORE–Centre for Experimental and Clinical Infection Research, a joint venture between the Hannover Medical School and the Helmholtz Centre for Infection Research, Hannover, Germany.
2Centre for Individualised Infection Medicine (CiiM), a joint venture between the Helmholtz Centre for Infection Research and Hannover Medical School, Hannover, Germany.
3Department of Gastroenterology, Hepatology, Infectious Diseases and Endocrinology, and
4Cluster of Excellence RESIST (EXC 2155), Hannover Medical School, Hannover, Germany.
5Hannover Biomedical Research School (HBRS) and Center for Infection Biology (ZIB), Hannover, Germany.
6Biomedical Research in End-Stage and Obstructive Lung Disease Hannover (BREATH), German Center for Lung Research (DZL), Hannover, Germany.
7Institute of Biosciences and BioResources, National Research Council (CNR), Naples, Italy.
8Department of Biology, University of Naples Federico II, Naples, Italy.
9Center for Systems Neuroscience (ZSN), Hannover, Germany.
10PRACTIS Clinician Scientist Program, Dean’s Office for Academic Career Development, and
11Department of Neurology and Clinical Neurophysiology, Hannover Medical School, Hannover, Germany
12Clinic for Pediatric Kidney, Liver, Metabolic, and Neurological Diseases, Hannover Medical School, Hannover, Germany.
13Department of Neurology, Center for Translational Neuro- and Behavioral Sciences (C-TNBS), University Medicine Essen, Essen, Germany.
14Department of Rheumatology and Immunology, Hannover Medical School, Hannover, Germany.
15DIAKOVERE Henriettenstift, Clinic for Neurology and Clinical Neurophysiology, Hannover, Germany.
16Laboratory of Molecular Neurosciences, Department of Psychiatry, Social Psychiatry and Psychotherapy, Hannover Medical School, Hannover, Germany.
Address for correspondence. Peter Claus, Hannover Medical School, Laboratory of Molecular Neurosciences, Feodor-Lynen-Str. 35, 30625 Hannover, Germany. Phone: 49.511.532.7275; Email: claus.peter@mh-hannover.de.
Authorship note: IT and KRS are co–first authors and contributed equally to this work. UK and PC are co-senior authors.
Find articles by Petri, S. in: PubMed | Google Scholar
1TWINCORE–Centre for Experimental and Clinical Infection Research, a joint venture between the Hannover Medical School and the Helmholtz Centre for Infection Research, Hannover, Germany.
2Centre for Individualised Infection Medicine (CiiM), a joint venture between the Helmholtz Centre for Infection Research and Hannover Medical School, Hannover, Germany.
3Department of Gastroenterology, Hepatology, Infectious Diseases and Endocrinology, and
4Cluster of Excellence RESIST (EXC 2155), Hannover Medical School, Hannover, Germany.
5Hannover Biomedical Research School (HBRS) and Center for Infection Biology (ZIB), Hannover, Germany.
6Biomedical Research in End-Stage and Obstructive Lung Disease Hannover (BREATH), German Center for Lung Research (DZL), Hannover, Germany.
7Institute of Biosciences and BioResources, National Research Council (CNR), Naples, Italy.
8Department of Biology, University of Naples Federico II, Naples, Italy.
9Center for Systems Neuroscience (ZSN), Hannover, Germany.
10PRACTIS Clinician Scientist Program, Dean’s Office for Academic Career Development, and
11Department of Neurology and Clinical Neurophysiology, Hannover Medical School, Hannover, Germany
12Clinic for Pediatric Kidney, Liver, Metabolic, and Neurological Diseases, Hannover Medical School, Hannover, Germany.
13Department of Neurology, Center for Translational Neuro- and Behavioral Sciences (C-TNBS), University Medicine Essen, Essen, Germany.
14Department of Rheumatology and Immunology, Hannover Medical School, Hannover, Germany.
15DIAKOVERE Henriettenstift, Clinic for Neurology and Clinical Neurophysiology, Hannover, Germany.
16Laboratory of Molecular Neurosciences, Department of Psychiatry, Social Psychiatry and Psychotherapy, Hannover Medical School, Hannover, Germany.
Address for correspondence. Peter Claus, Hannover Medical School, Laboratory of Molecular Neurosciences, Feodor-Lynen-Str. 35, 30625 Hannover, Germany. Phone: 49.511.532.7275; Email: claus.peter@mh-hannover.de.
Authorship note: IT and KRS are co–first authors and contributed equally to this work. UK and PC are co-senior authors.
Find articles by
Kalinke, U.
in:
PubMed
|
Google Scholar
|

1TWINCORE–Centre for Experimental and Clinical Infection Research, a joint venture between the Hannover Medical School and the Helmholtz Centre for Infection Research, Hannover, Germany.
2Centre for Individualised Infection Medicine (CiiM), a joint venture between the Helmholtz Centre for Infection Research and Hannover Medical School, Hannover, Germany.
3Department of Gastroenterology, Hepatology, Infectious Diseases and Endocrinology, and
4Cluster of Excellence RESIST (EXC 2155), Hannover Medical School, Hannover, Germany.
5Hannover Biomedical Research School (HBRS) and Center for Infection Biology (ZIB), Hannover, Germany.
6Biomedical Research in End-Stage and Obstructive Lung Disease Hannover (BREATH), German Center for Lung Research (DZL), Hannover, Germany.
7Institute of Biosciences and BioResources, National Research Council (CNR), Naples, Italy.
8Department of Biology, University of Naples Federico II, Naples, Italy.
9Center for Systems Neuroscience (ZSN), Hannover, Germany.
10PRACTIS Clinician Scientist Program, Dean’s Office for Academic Career Development, and
11Department of Neurology and Clinical Neurophysiology, Hannover Medical School, Hannover, Germany
12Clinic for Pediatric Kidney, Liver, Metabolic, and Neurological Diseases, Hannover Medical School, Hannover, Germany.
13Department of Neurology, Center for Translational Neuro- and Behavioral Sciences (C-TNBS), University Medicine Essen, Essen, Germany.
14Department of Rheumatology and Immunology, Hannover Medical School, Hannover, Germany.
15DIAKOVERE Henriettenstift, Clinic for Neurology and Clinical Neurophysiology, Hannover, Germany.
16Laboratory of Molecular Neurosciences, Department of Psychiatry, Social Psychiatry and Psychotherapy, Hannover Medical School, Hannover, Germany.
Address for correspondence. Peter Claus, Hannover Medical School, Laboratory of Molecular Neurosciences, Feodor-Lynen-Str. 35, 30625 Hannover, Germany. Phone: 49.511.532.7275; Email: claus.peter@mh-hannover.de.
Authorship note: IT and KRS are co–first authors and contributed equally to this work. UK and PC are co-senior authors.
Find articles by
Claus, P.
in:
PubMed
|
Google Scholar
|
Published August 25, 2026 - More info
J Clin Invest. 2026;136(21):e203540. https://doi.org/10.1172/JCI203540.
© 2026 Tapken et al. This work is licensed under the Creative Commons Attribution 4.0 International License. To view a copy of this license, visit http://creativecommons.org/licenses/by/4.0/.
Received: December 19, 2025; Accepted: August 18, 2026

Related article:
Abstract
Spinal muscular atrophy (SMA) is characterized by motor neuron degeneration due to deficiency in the survival of motor neuron (SMN) protein. Disease-modifying therapies have transformed outcomes in SMA, while also revealing an increasingly complex spectrum of residual disease biology. In this issue of the JCI, Tapken, Rahmel-Stein, and colleagues demonstrated cell-specific SMN expression and persistent alterations in peripheral immune cell populations in nusinersen- or risdiplam-treated adults with SMA. Their findings extend the question of selective vulnerability beyond motor neurons and raise an increasingly important therapeutic question: What constitutes adequate SMN restoration? This Commentary considers how cell type, developmental timing, SMN requirement, and downstream response may shape treatment-modified SMA, with implications for systemic and CNS-directed therapies.
Authors
Crystal Jing Jing Yeo
-
Results
SMA mice from the Taiwanese mouse model show reduced splenic B cell numbers early after birth. In humans, the SMN locus typically contains 1 copy of SMN1 and a variable number of SMN2 copies on each allele (ranging from 1 to ~8) (3, 39, 40). Development of SMA results from a homozygous deletion of, or mutations in, the SMN1 gene (4). In contrast to humans, mice only have 1 Smn gene, and Smn KO is embryonically lethal (41, 42). Notably, Smn-deficient mice that carry 1 transgene allele with 2 human SMN2 gene copies (Smn–/– SMN2tg/0) display a disease phenotype reminiscent of severe type I SMA. This model, known as the Taiwanese SMA mouse, produces litter that is 50% Smn–/– SMN2tg/0 (SMA mice) and 50% Smn+/– SMNtg/0 (littermate controls), the latter of which do not develop disease by P3 (Figure 1A) (41).
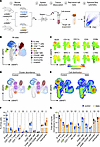 Figure 1
SMA mice show a significant loss of B cells in the spleen at P3. (A) Schematic representation of the experimental workflow. Transgenic (mSmn–/– hSMN2tg/tg) and heterozygous (mSmn+/–) mice were bred to obtain control (mSmn+/– hSMN2tg/0) and SMA (mSmn-/-; hSMN2tg/0) offspring. Spleens were extracted at P3 from littermates (SMA n = 5, control n = 5), followed by tissue dissociation, RBC lysis, and spectral flow cytometric analysis of single-cell suspensions. FSC, forward scatter; SSC, side scatter. (B) UMAP representation of splenic immune cells calculated from all samples and phenotypic markers; colored according to cell type. Clustering is based on gating shown in Supplemental Figure 1A. Mφ, macrophages. (C) Heatmap-coded UMAPs showing expression intensity of individual surface markers across the identified clusters. (D) Contour UMAPs showing immune cell abundance and clustering patterns of splenocytes from SMA and control animals (E) Density UMAPs comparing the local distribution and abundance of immune cell populations between control and SMA animal data. (F and G) Quantification of flow cytometric data for relative abundances (F) and total cell counts (G) of immune cell subsets in control (blue, filled) and SMA mouse spleens (orange, circle). Data represent the mean ± SD. Each data point is an individual biological replicate. An unpaired, 2-tailed Student’s t test without multiple comparisons for each cell type data set was used separately. *P < 0.05.
To analyze the immune cell composition of the premature spleen, we performed multicolor spectral flow cytometry on splenocytes isolated from P3 Taiwanese SMA mice. Briefly, spleens were extracted, mechanically dissociated into single-cell suspensions, and labeled with fluorescently conjugated antibodies directed against the lineage markers B220, CD3, CD4, CD8, CD11b, CD11c, F4/80, Ly6C, Ly6G, NKp46, CD86, and CD206 (Figure 1A, steps 2–5, and Supplemental Figure 1A; supplemental material available online with this article; https://doi.org/10.1172/JCI203540DS1). Dimensionality reduction (uniform manifold approximation and projection [UMAP]) analysis revealed that P3 splenocytes were primarily composed of B cells, monocytes, and neutrophils (Figure 1, B and C). Although the same major immune cell clusters were identified in SMA mice and littermate controls (Figure 1D), SMA mice exhibited markedly reduced B cells and increased neutrophils (Figure 1E). Relative quantification of splenic immune cell subsets showed significantly decreased B cells (10.7% vs. 29.2% in controls) and DCs (0.3% vs. 0.7% in controls), as well as increased neutrophils (23.5% vs. 10.2% in controls), macrophages (15.3% vs. 9.8% in controls), and CD8+ T cells (0.8% vs. 0.4% in controls) (Figure 1F). Analysis of absolute cell numbers confirmed the significant decrease in B cells, DCs, and CD4+ T cells, and the increase in neutrophils and macrophages, whereas absolute CD8+ T cell counts did not differ between SMA mice and control littermates (Figure 1G). Together, these results indicate a loss of B cells and an increase in neutrophils and macrophages in spleens of P3 SMA mice.
Absolute SMN protein levels vary across splenic immune cell subsets from mice at P3, with B cells showing the highest expression. To assess SMN protein levels in different immune cell subsets of P3 spleens, we measured intracellular SMN expression by spectral flow cytometry. Quantification of the geometric MFI (gMFI) in control mice showed SMN expression across all analyzed cell subsets, with particularly high SMN levels in the B cell cluster (Figure 2A). SMN expression profiles of individual animals indicated 2 distinct cell populations characterized by low and high protein levels (Figure 2B, left). Analysis of specific immune cell subsets further demonstrated that B cells and macrophages expressed the highest SMN levels and CD4+ T cells and neutrophils the lowest SMN levels (Figure 2B, right).
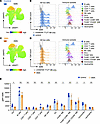 Figure 2
B cells and macrophages express particularly high SMN levels in the spleens of neonatal mice. (A) UMAP with heatmap visualization of SMN expression in immune cells from control mice. (B) Histogram overlays displayed on a subpanel-specific relative half-offset scale (y axis) showing total SMN protein expression (x axis) across all immune cells in control mice (n = 5, left) and in individual immune cell clusters of 1 representative animal (right), colored according to cluster identity. 2nd AB only, secondary antibody only. (C) UMAP visualization of SMN expression in immune cells from SMA mice, using the same heatmap scale as in A. (D) Histogram overlays displayed as in B for SMA mice (n = 5, left) and the corresponding immune cell clusters of 1 representative animal (right), matching the cluster identities shown in B. Histograms were independently normalized within each subpanel, with the y axis representing the percentage of the maximum bin count in that subpanel. Therefore, the histogram heights do not reflect the absolute immune cell subset frequencies and should only be compared within a given subpanel. For comparisons of immune cell frequencies between subpanels, refer to Figure 1. The x axis uses a common scale for SMN expression (x axis) across all panels. Vertical reference lines indicate identical x values for better comparison between control and SMA samples. (E) Quantification of gMFI SMN protein expression levels across immune cell clusters in control (blue) and SMA (orange) littermates at P3. Each data point represents an individual biological replicate. Data indicate the mean ± SD. An unpaired, 2-tailed Student’s t test without multiple comparisons was used for each cell-type data set. *P < 0.05.
In SMA mice, SMN expression mapped to a cluster similar to that observed in control littermates (Figure 2C). However, the independently normalized histogram revealed a relative decrease in cells with high SMN levels in SMA animals when compared with controls (Figure 2D, left). This observation is consistent with the reduced abundance of B cells (Figure 1, F and G), which likely contributed to the diminished SMN-high signal. Furthermore, as observed in control mice, B cells and macrophages showed the highest SMN expression in SMA animals (Figure 2D, right), whereas quantification of SMN levels among all live cells indicated that F4/80+ macrophages and monocytes from SMA mice expressed significantly lower SMN levels than did the corresponding cell subsets in littermate controls (Figure 2E). In contrast, the immunosuppressive CD206+ F4/80+ macrophage subset showed even higher SMN levels in SMA mice than in littermate controls (Figure 2E). To further determine whether SMN levels are linked to immune cell differentiation, we analyzed additional markers including CD80, Ly6C, and MHC-I/-II, which are associated with myeloid cell stimulation and differentiation (Supplemental Figure 1B). Among these markers, only MHC-I showed a moderate positive correlation with SMN expression in control mice. However, further mechanistic studies are required to determine whether this association has functional relevance.
The high SMN expression in B cells and macrophages, together with the relative loss of the SMN-high peak in SMA mice, prompted us to perform a more detailed analysis of immune cell subsets within the SMN-low and SMN-high populations (Supplemental Figure 2A). Of note, the majority of cells lost in P3 spleens of SMA mice belonged to the SMN high population (Supplemental Figure 2B), which included both B220+ B cells and F4/80+ macrophages (Supplemental Figure 2, C and D). As shown above, in SMA animals, B cells were significantly decreased and macrophages were increased, regarding both their relative proportion and absolute cell counts, suggesting that the loss of the SMN-high population resulted primarily from the reduction in B cells rather than macrophages (Figure 1, F and G). In summary, B cells and macrophages expressed the highest SMN levels in the spleens of P3 control animals. In SMA mice, SMN levels were significantly reduced in F4/80+ macrophages and monocytes and increased in CD206-expressing macrophages. Although SMN levels in B cells of SMA mice were largely maintained, the overall number of B cells was reduced.
B cell numbers are increased in PBMCs of adult patients with SMA. To determine potential alterations in the immune cell composition of patients with SMA, we performed spectral flow cytometry of PBMCs from 23 adult patients with SMA and 16 healthy controls (Figure 3A). Immune cell populations were identified by the expression of established cell-surface markers (Supplemental Figure 3A). UMAP projections of PBMCs revealed distinct clusters corresponding to B cells, T cells, NK cells, monocytes, DCs, and basophils (Figure 3B). Interestingly, patients with SMA displayed a markedly altered PBMC subset distribution when compared with healthy controls (Figure 3C). Specifically, quantification of CD45+ cells showed that B cells and CD4+ T cells were significantly increased, whereas CD8+ T cells and NK cells were significantly reduced in patients with SMA (Figure 3D). In addition, monocytes were moderately increased, although the values varied among individual patients (Supplemental Figure 4, A and B). Given the alterations in T cell subsets of patients with SMA, we next examined the activation status of professional antigen-presenting cells by measuring the expression of MHC and costimulatory molecules. On cDC1, MHC-I expression (gMFI of HLA-A, -B, and -C [HLA-ABC]) was slightly elevated, whereas MHC-II expression (gMFI of HLA-DR) was reduced on monocytes and cDC2 (Figure 3, E and F). The costimulatory molecule CD86 was not significantly changed (Figure 3G), and CD40 expression levels were comparable between patients with SMA and controls (Figure 3H). In summary, PBMCs from patients with SMA were characterized by increased B cell and CD4+ T cell frequencies along with decreased CD8+ T cell and NK cell frequencies.
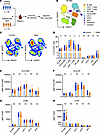 Figure 3
B, T, and NK cell abundances are altered in peripheral blood of treated adult patients with SMA. (A) Experimental scheme: PBMCs were isolated from healthy controls (n = 16) and patients with SMA (n = 23), followed by immune cell labeling and spectral flow cytometric analysis. (B) UMAP projection of CD45+ immune cells from all study participants based on phenotypic gates, colored according to cluster identity. (C) UMAP density plots of CD45+ immune cells from controls and patients with SMA, highlighting overall cellular composition. (D) Quantification of immune cell subset frequencies as a percentage of CD45+ cells in controls (blue) and patients with SMA (orange). Data represent the mean ± SD. *P < 0.05, by unpaired, 2-tailed Student’s t test without multiple test correction. (E–H) Expression levels of activation and antigen presentation markers on the indicated cell types, shown as gMFI: (E) HLA-ABC, (F) HLA-DR, (G) CD86, and (H) CD40. Data indicate the mean ± SD. Data represent the mean ± SD. *P < 0.05, by unpaired, 2-tailed Student’s t test without multiple test correction.
SMN protein levels are reduced in DCs from adult patients with SMA. Overall, SMN expression was globally reduced across all analyzed immune cell subsets in patients with SMA relative to healthy controls (Figure 4A). In PBMCs of healthy controls, we detected particularly high SMN levels in monocytes and DC clusters (Figure 4B), which was in contrast to the murine P3 spleen, in which B cells displayed the highest SMN expression (Figure 2A). Additionally, while P3 mouse splenocytes showed 2 distinct SMN expression peaks (Figure 2B, left), human PBMCs displayed a single, relatively broad peak (Figure 4C, left). Analysis of single immune cell subsets confirmed that monocytes and DCs showed the highest SMN expression in healthy controls (Figure 4C, right). Despite overall reduced SMN levels in patients with SMA (Figure 4A), the distribution of SMN across immune cell clusters matched that of healthy controls (Figure 4D). Importantly, SMN expression levels were reduced in all but 1 patient with SMA when compared with healthy controls (Figure 4E, left, Supplemental Figure 5). As shown for a representative risdiplam-treated patient, DCs exhibited the strongest reduction of SMN levels compared with controls, whereas the other immune cell subsets were less affected (Figure 4E, right). Additionally, higher SMN expression levels were associated with increased HLA-ABC and decreased CD80 expression, whereas no significant correlation was observed for HLA-DR or CD40 (Supplemental Figure 3, B and C). Taken together, in PBMCs of healthy controls, DCs and monocytes expressed the highest SMN levels. In contrast, in patients with SMA, SMN expression was reduced across all immune cells, and particularly in DCs; however, DCs and monocytes still retained the highest SMN levels relative to other immune cell subsets.
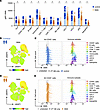 Figure 4
SMN expression is reduced across all immune cell types of treated adult SMA patients. (A) Quantification of gMFI SMN protein expression across immune cell clusters in healthy controls and patients with SMA. Each data point represents an individual biological replicate, and data represent the mean ± SD. Statistical comparisons between groups were performed for each cell type using an unpaired, 2-tailed Student’s t test without multiple comparisons. *P < 0.05. Samples were acquired in 2 independent experiments performed on consecutive days. Statistical analyses include all samples from both experiments, whereas the histogram overlays and UMAP visualizations shown in B–E are representative of 1 experiment. (B) UMAP visualization of SMN expression in CD45+ immune cells from a representative healthy control dataset, displayed using a heatmap color scale. SMN expression is shown as the gMFI. (C) Histogram overlays showing total SMN protein expression levels across all immune cells in PBMCs from healthy controls (n = 7, left) and in individual immune cell clusters of 1 representative control sample (right), colored according to cluster identity. (D) UMAP visualization of SMN expression in immune cells from patients with SMA, using the same heatmap scale as in B. (E) Histogram overlays showing total SMN protein expression in PBMCs from patients with SMA (n = 13, left) and in individual immune cell clusters of 1 representative risdiplam-treated patient, matching the cluster identities shown in C. Histograms were normalized independently for each subpanel, with the y axis representing the percentage of the maximum bin count within that subpanel (for comparisons of immune cell frequencies between subpanels, refer to Figure 3). The x axis shows SMN expression on a common scale across all panels. Vertical reference lines indicate identical x values for better comparison between control and SMA samples.
Risdiplam- and nusinersen-treated patients exhibit comparable immune profiles, with persistent divergence from healthy controls. To assess how SMN-targeted therapies influence the peripheral immune cell composition and SMN expression, we analyzed PBMCs from patients with SMA treated with either nusinersen or risdiplam. Nusinersen is administered intrathecally and does not cross the blood-brain barrier (BBB), which results in CNS-restricted activity. Risdiplam, on the other hand, is administered orally, passes the BBB, and exerts systemic effects (35, 43). The studied SMA cohort included patients with type II and III SMA (Figure 5A and Supplemental Table 1). Importantly, patients with SMA and healthy controls were similar in age (Figure 5B) and showed a comparable sex distribution (Figure 5C). Furthermore, clinical motor scores aligned with the ambulatory status of the patients (Figure 5D). Overall, the cohort comprised 15 nusinersen- and risdiplam-treated patients (Figure 5E). PBMCs of all patients showed reduced SMN expression relative to that in healthy control PBMCs; however, the decrease in SMN expression reached statistical significance only in the nusinersen-treated group (Figure 5E). Comparison of SMN2 copy numbers with SMN levels in individual patients revealed a positive correlation (Figure 5F), which is in accordance with the established contribution of the SMN2 locus to full-length stable SMN expression in patients with deleted or mutated SMN1. To determine whether treatment with risdiplam, which enhances SMN expression from the SMN2 gene systemically, influences this relationship, we analyzed each treatment group separately. However, within the groups, we found that SMN2 copy numbers did not correlate with SMN levels, probably because of the limited number of patients analyzed (statistics not shown). As SMN levels in PBMCs of healthy individuals have previously been reported to decrease with age, i.e., between infancy and adulthood (32, 44, 45), we next analyzed the relationship between SMN expression and age in adults. Surprisingly, SMN levels in healthy controls showed a significant positive correlation with increasing age (Figure 5G). To ensure that age differences did not confound comparisons between treatment groups, we calculated the average age of patients, which was 42.6 years (25–70 years) for the nusinersen-treated group and 36.9 years (18–57 years) for the risdiplam-treated group. The healthy control group had an average age of 35.9 years (19–64 years). These findings indicate that age differences are unlikely to account for the reduced SMN levels observed in patients with SMA or variations between treatment groups. Since DCs showed the highest SMN expression levels in PBMCs, we additionally correlated their frequency with patient age. In healthy individuals, DC frequency significantly increased with age, potentially contributing to the age-associated increase in SMN levels observed in CD45+ cells (Supplemental Figure 3D).
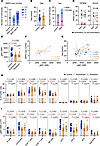 Figure 5
Adult patients with SMA treated with nusinersen exhibit a more pronounced change in PBMC composition compared with those treated with risdiplam. (A) Distribution of SMN2 gene copy numbers among patients with SMA. Controls (gray, n = 16) and patients with SMA (type II, n = 9; type III, n = 14) are shown. The number of SMN2 copies (copies 2, 3, 4, and 6) is indicated by different shades of blue; n.d., not determined. (B) Age distribution for healthy controls (blue) and patients with SMA (orange). Data indicate the mean ± SD. (C) Sex distribution of study participants. (D) Clinical motor function scores for patients with SMA at initial presentation and at the time of analysis. The HFMSE and RULM scores are shown for ambulatory (black) and nonambulatory (red) individuals. (E) SMN expression levels (gMFI) of CD45+ in controls (blue), nusinersen-treated patients (n = 15, orange, circle), and risdiplam-treated patients (n = 8, orange stripes, triangle). One-way ANOVA followed by Šidák’s multiple-comparison test was performed to analyze differences between groups; P < 0.05 was considered significant (red); exact P values are displayed. (F and G) Correlation of SMN levels (gMFI) to SMN2 gene copy number (F) and age (G) by linear regression with 95% CI; coefficient of determination (r2) and P values are shown. Treatment groups are indicated by data point shape. The legend is shown in H. (H and I) Quantification of immune cell subset frequencies as a percentage of CD45+ cells (H) and gMFI SMN levels (I) in control individuals (blue) and treated patients with SMA (nusinersen – orange + circle, risdiplam – striped orange + triangle). Data represent the mean ± SD. Statistical significance was assessed using 1-way ANOVA followed by Šidák’s multiple-comparison test; P < 0.05 was considered significant (red); exact P values are displayed.
Evaluation of the PBMC subset composition demonstrated that nusinersen-treated patients showed a significant increase in CD4+ T cells and a decrease in CD8+ T cells and NK cells compared with healthy controls (Figure 5H). SMN levels were significantly decreased in all immune cell subsets, with the exception of CD4+ T cells (Figure 5I). In contrast, PBMCs from risdiplam-treated patients showed no significant deviations from controls, even though subset frequencies and SMN levels did not fully reach control levels. Finally, we analyzed the correlation of clinical motor scores (Hammersmith Functional Motor Scale [HFSME] and Revised Upper Limb Module [RULM]) with SMN levels in patients, but high inter-individual variations prevented conclusions (Supplemental Figure 3, E and F). Thus, our data suggest that risdiplam-treated patients had immune cell frequencies that were more similar to those of healthy controls than nusinersen-treated patients, indicating a potentially greater systemic effect. However, conclusions regarding treatment-specific effects are limited by the lack of longitudinal samples and untreated controls.
Untreated and treated patients with SMA display comparable SMN deficiency and immune cell alterations. To distinguish disease-associated from treatment-associated effects on PBMC composition and SMN expression, we performed an exploratory analysis including untreated patients with SMA (Figure 6A). As disease-modifying treatments are widely available in Europe, untreated samples from adult patients with SMA are rare and were therefore not included in the primary cohort. Samples were matched when possible (Supplemental Table 2). In addition, samples from treated patients with SMA included in the primary cohort were reanalyzed together with the untreated samples and yielded comparable results, supporting the reproducibility of the findings (analysis not shown).
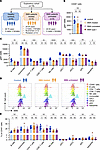 Figure 6
Adult patients with SMA treated with nusinersen or risdiplam show comparable reduction of SMN expression and alterations in PBMC composition relative to untreated patients with SMA. (A) Exploratory cohort scheme: analysis of PBMCs from healthy controls (n = 6), nusinersen-treated patients with SMA, or risdiplam-treated patients with SMA (a subset of the study cohort above and 1 SMA type I patient, n = 5) and untreated patients with SMA (n = 6). Clinical data are listed in Supplemental Table 2. (B and C) SMN expression levels (gMFI) of CD45+ cells (B) and immune cell subsets (C) in controls (blue circles), treated patients (orange circles, type I with red asterisk), and untreated patients (purple diamonds). Data are presented as the mean ± SD. *P < 0.05, **P < 0.01, ***P < 0.001, and ****P < 0.0001, by 1-way ANOVA followed by Šidák’s multiple-comparison test. (D) Histogram overlays showing total SMN protein expression levels across immune cell subsets in 1 representative individual per analysis group, colored according to cluster identity. Histograms were normalized independently for each subpanel, with the y axis representing the percentage of the maximum bin count within that subpanel. The x axis shows SMN expression on a common scale across all panels. Vertical reference lines indicate identical x values for better comparison between control, SMA treated, and SMA untreated samples. (E) Quantification of immune cell subset frequencies as a percentage of CD45+ cells in controls, treated patients with SMA, and untreated patients with SMA. *P < 0.05, by 1-way ANOVA followed by Šidák’s multiple-comparison test.
SMN expression levels in total CD45+ cells were similarly reduced in treated and untreated patients with SMA, although the differences compared with healthy controls did not reach significance. Slight deviations from results shown in Figure 3D and Figure 4A are probably due to the smaller sample size and the inclusion of a single SMA type I patient sample (red asterisk) (Figure 6B). Analysis of individual immune subsets showed significantly reduced SMN levels in untreated patients with SMA and in most subsets from treated patients with SMA compared with healthy controls (Figure 6C). Therefore, we conclude that both SMN-enhancing therapies appeared unable to sustain SMN levels across immune cell populations comparable to the levels observed in healthy controls. Nevertheless, histogram analysis confirmed that monocytes and DCs consistently exhibited the highest SMN expression across all analyzed sample groups (Figure 6D). As shown previously, B cells were significantly increased and CD8+ T cells were decreased within the CD45+ compartment of treated patients with SMA (Figure 3D). Importantly, untreated and treated patients with SMA showed similar immune cell alterations relative to healthy controls (Figure 6E). In conclusion, this exploratory analysis provides additional evidence that reduced SMN levels and altered immune cell distributions persisted in PBMCs from adult patients with SMA despite treatment.
Aberrantly spliced SMNΔ7 mRNA levels decrease and SMN accumulates in spliceosome biogenesis–associated Cajal bodies during THP-1 cell differentiation. Since monocytes and monocyte-derived myeloid cell subsets expressed the highest SMN levels among human PBMCs (Figure 4B), we performed exploratory experiments to determine the role of SMN in human monocytic THP-1 cells (Figure 7A). PMA-induced differentiation of THP-1 cells (PMA–THP-1) was accompanied by a shift from suspension to adherent growth, along with pronounced morphological changes (Figure 7A).
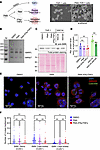 Figure 7
SMNΔ7 mRNA levels decrease and number of SMN+ Cajal bodies increase during PMA-induced THP-1 differentiation. (A) Schematic depiction of PMA-induced THP-1 differentiation and subsequent IFN-γ and TNF-α stimulation. As a control, cells were treated with DMSO devoid of PMA. The arrows indicate adherent cells. Images were taken in 20x magnification. (B) Representative (n = 1) agarose gel showing SMN splicing products amplified using primers spanning exons 6–8. (C) Western blot analysis of SMN protein levels in THP-1 cells, PMA-stimulated THP-1 cells, and PMA–IFN-γ/TNF-α–stimulated THP-1 cells, and the motoneuron-like cell line NSC34 with and without starvation for cellular differentiation. Data were normalized to total protein by Ponceau S staining. A representative blot for 3 individual cell cultures and blots is shown. (D) Quantification of SMN protein levels by Western blotting. A multiple-comparison, 2-tailed Student’s t test was performed to determine significance. Data represent the mean ± SD. (E) Representative confocal microscopy images analyzing SMN localization (red) in THP-1 cells (n = 56), PMA-differentiated THP-1 (PMA–THP-1, n = 87), and IFN-γ/TNF-α–stimulated PMA–THP-1 (n = 45). Nuclei were stained with DAPI (blue), and Cajal bodies are labeled as Coilin+ (green). Scale bar: 20 μm. Enlarged cells are highlighted by a white box and show a digitally magnified region of interest. (F) Quantification of SMN+ nuclear bodies per cell. Nuclear bodies were categorized as SMN+ Gems (Coilin–) or SMN– or SMN+ Cajal bodies (Coilin+). *P < 0.0 and ** P < 0.01, by 1-way ANOVA with multiple-comparison correction. Each dot represents a single cell, and data represent the mean ± SD.
To examine the effect of differentiation on SMN mRNA splicing, we analyzed both the full-length properly spliced SMN mRNA isoforms of SMN1 and SMN2, which encode the functional SMN protein, and the alternatively spliced isoform lacking exon 7 (SMNΔ7), which accounts for approximately 80% of SMN2 transcripts and produces a shortened, less stable protein. Consequently, lower levels of full-length SMN could indicate a reduced abundance of functional protein, thereby limiting snRNP assembly activity (3, 46). Surprisingly, full-length SMN mRNA levels remained stable during THP-1 differentiation and cytokine stimulation, but SMNΔ7 levels decreased, as assessed by quantitative agarose gel electrophoresis (n = 1) (Figure 7B). We next analyzed SMN protein expression during differentiation of THP-1 and NSC34 cells, the latter of which is an immortalized motor neuron–like cell line commonly used to study SMN biology (47, 48). Despite high basal SMN expression in NSC34 cells, differentiation of both cell types did not affect SMN protein levels, as shown by Western blot analysis (Figure 7, C and D). The SMN protein localizes to multiple cellular compartments, including distinct subnuclear structures known as coilin+ Cajal bodies and coilin– gems, both of which contain components of the Gemin complex (49, 50). Cajal bodies additionally contain snRNPs and are implicated in tri-snRNP biogenesis (24, 51). Confocal imaging of SMN subcellular localization revealed its presence in Cajal bodies and gems across all analyzed cell types, including untreated THP-1 cells, PMA–THP-1 cells, and IFN-γ–/TNF-α–stimulated PMA–THP-1 cells (Figure 7, E and F). Notably, PMA-induced differentiation of THP-1 cells was associated with a significant increase in the maximum intensity projection of the SMN signal (not quantified) and a higher number of SMN+ Cajal bodies, indicating enhanced SMN involvement in tri-snRNP assembly during THP-1 cell differentiation. In summary, differentiation does not alter total SMN protein levels in THP-1 or NSC34 cells but is associated with reduced levels of the aberrantly spliced SMNΔ7 mRNA, which suggests a shift in the regulation of SMN gene expression or SMNΔ7 mRNA decay. Moreover, PMA-induced differentiation results in an increased number of SMN+ Cajal bodies indicating enhanced recruitment of SMN to snRNP maturation sites. These exploratory experiments give a first impression on the importance of SMN during differentiation, although additional studies are required to define its precise function in primary immune cells.


Copyright © 2026 American Society for Clinical Investigation
ISSN: 0021-9738 (print), 1558-8238 (online)