
Advertisement
Research ArticleGeneticsNephrology
Open Access |  10.1172/JCI203177
PKD1 upstream open reading frames affect Polycystin-1 expression and polycystic kidney disease phenotypes
Zhigui Li, Zi Guo, Soyoung Cho, Rishi Bhardwaj, Ke Dong, Sorin Fedeles, and Whitney Besse
Department of Internal Medicine, Section of Nephrology, Yale School of Medicine, New Haven, Connecticut, USA.
Address correspondence to: Whitney Besse, Section of Nephrology, Yale University School of Medicine, P.O. Box 208029, 330 Cedar Street, New Haven, Connecticut, 06520, USA. Phone: 203.737.5298; Email: whitney.besse@yale.edu.
Authorship note: ZL and ZG contributed equally to this work.
Find articles by Li, Z. in: PubMed | Google Scholar
Department of Internal Medicine, Section of Nephrology, Yale School of Medicine, New Haven, Connecticut, USA.
Address correspondence to: Whitney Besse, Section of Nephrology, Yale University School of Medicine, P.O. Box 208029, 330 Cedar Street, New Haven, Connecticut, 06520, USA. Phone: 203.737.5298; Email: whitney.besse@yale.edu.
Authorship note: ZL and ZG contributed equally to this work.
Find articles by Guo, Z. in: PubMed | Google Scholar
Department of Internal Medicine, Section of Nephrology, Yale School of Medicine, New Haven, Connecticut, USA.
Address correspondence to: Whitney Besse, Section of Nephrology, Yale University School of Medicine, P.O. Box 208029, 330 Cedar Street, New Haven, Connecticut, 06520, USA. Phone: 203.737.5298; Email: whitney.besse@yale.edu.
Authorship note: ZL and ZG contributed equally to this work.
Find articles by Cho, S. in: PubMed | Google Scholar
Department of Internal Medicine, Section of Nephrology, Yale School of Medicine, New Haven, Connecticut, USA.
Address correspondence to: Whitney Besse, Section of Nephrology, Yale University School of Medicine, P.O. Box 208029, 330 Cedar Street, New Haven, Connecticut, 06520, USA. Phone: 203.737.5298; Email: whitney.besse@yale.edu.
Authorship note: ZL and ZG contributed equally to this work.
Find articles by Bhardwaj, R. in: PubMed | Google Scholar
Department of Internal Medicine, Section of Nephrology, Yale School of Medicine, New Haven, Connecticut, USA.
Address correspondence to: Whitney Besse, Section of Nephrology, Yale University School of Medicine, P.O. Box 208029, 330 Cedar Street, New Haven, Connecticut, 06520, USA. Phone: 203.737.5298; Email: whitney.besse@yale.edu.
Authorship note: ZL and ZG contributed equally to this work.
Find articles by
Dong, K.
in:
PubMed
|
Google Scholar
|

Department of Internal Medicine, Section of Nephrology, Yale School of Medicine, New Haven, Connecticut, USA.
Address correspondence to: Whitney Besse, Section of Nephrology, Yale University School of Medicine, P.O. Box 208029, 330 Cedar Street, New Haven, Connecticut, 06520, USA. Phone: 203.737.5298; Email: whitney.besse@yale.edu.
Authorship note: ZL and ZG contributed equally to this work.
Find articles by Fedeles, S. in: PubMed | Google Scholar
Department of Internal Medicine, Section of Nephrology, Yale School of Medicine, New Haven, Connecticut, USA.
Address correspondence to: Whitney Besse, Section of Nephrology, Yale University School of Medicine, P.O. Box 208029, 330 Cedar Street, New Haven, Connecticut, 06520, USA. Phone: 203.737.5298; Email: whitney.besse@yale.edu.
Authorship note: ZL and ZG contributed equally to this work.
Find articles by
Besse, W.
in:
PubMed
|
Google Scholar
|
Published July 28, 2026 - More info
J Clin Invest. 2026;136(18):e203177. https://doi.org/10.1172/JCI203177.
© 2026 Li et al. This work is licensed under the Creative Commons Attribution 4.0 International License. To view a copy of this license, visit http://creativecommons.org/licenses/by/4.0/.
Received: December 18, 2025; Accepted: July 14, 2026


-
Results
Defining PKD1 uORFs. The human PKD1 5’ UTR is 209 nucleotides in length and contains two occurrences of the ATG (AUG in mRNA) canonical start codon sequence 87 and 20 nucleotides before the start codon (c.–87 and c.–20, respectively) relative to the CDS start (Figure 1A). Translation from these potential start codons would encode a 7 or 5 amino acid peptide, respectively, before reaching a stop codon prior to CDS start. We defined these as “uORF1” and “uORF2.” Both uORFs and the PKD1 coding sequence have moderate strength Kozak sequences (57). Both uORFs are present in the genomic sequence of the 4 of 6 human PKD1 pseudogenes that contain the 5’ UTR but with 2 nucleotide differences in uORF1. Comparison of defined PKD1 5’ UTR sequences across mammalian species shows a conserved presence of ATG-initiated uORFs at near identical spacing from the CDS start and modestly conserved amino acid sequence (Figure 1B). The nucleotide sequence of uORF1 and uORF2 including start and stop codons is indeed more highly conserved than the remaining nucleotide sequence of the human 5’ UTR (“non-uORF”) (Supplemental Figure 1; supplemental material available online with this article; https://doi.org/10.1172/JCI203177DS1).
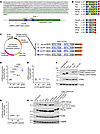 Figure 1
PKD1 5′ UTR has active uORFs that affect Polycystin-1 protein translation. (A) DNA sequence of human PKD1 exon 1. Green shading indicates the coding region (CDS) of Polycystin-1. The preceding sequence is the 5’ UTR. Potential start codons are underlined, including the only 2 ATG sequences at the c.–87 and c.–20 position. These ATG start codons initiate the proposed upstream open reading frames highlighted in blue, which we named uORF1 and uORF2. (B) Orthologues of PKD1 uORF1 and uORF2. (C) Illustration of psiCHECK2 luciferase construct with either the WT PKD1 5′ UTR sequence (“wt”), or versions with single nucleotide edit(s) of uORF1 or uORF2 start codons as indicated. Firefly luciferase expresses independently from the same construct to serve as an internal control for transfection efficiency. (D) Comparison of Renilla/Firefly protein expression detected by luciferase quantification for HEK293 cells transfected with luciferase construct of the indicated PKD1 5’ UTR variant. (E) No difference between Renilla/Firefly mRNA expression of the different constructs. (F) Anti-Renilla immunoblot of lysate from HEK293 cells transfected with the indicated constructs (Supplemental Figure 4 and Supplemental Table 1) that express a fusion protein of uORF1-Renilla (“Fus1”) or its negative control, or uORF2-Renilla (“Fus2”) or its negative control. The fusion protein constructs contain the minimum edits to remove the ATG of Renilla and put the uORF initiation site in frame. (G) Comparison of Renilla/Firefly expression from WT luciferase construct versus ΔuORF3, which only differs by c.A>T at c.–161. (H) Anti-Renilla immunoblot of lysate from HEK293 cells transfected with the indicated constructs (Supplemental Table 1). One-way ANOVA was applied in D and E, and 2-tailed t test in G. Significant differences are indicated.
PKD1 uORFs affect CDS translation: luciferase reporter assay. We hypothesized that PKD1 uORF1 and uORF2 contribute to the functionally borderline expression of Polycystin-1, which falls below a cystogenic threshold in patients with ADPKD and ADPLD. To assess the effect of PKD1 uORF1 and uORF2 on protein expression, we inserted the 209-nucleotide human PKD1 5’ UTR — either WT or uORF-edited — preceding Renilla luciferase coding sequence in a psiCheck2 dual luciferase expression plasmid (Figure 1C and Supplemental Table 1). To test the effect of blocking translation from uORF1, “ΔuORF1” contains a single A>T edit to the A of uORF1’s start codon, and, similarly, “ΔuORF2” and “ΔuORF1&2” contain the respective A>T edits to these start codon(s). We transfected independent wells of HEK293 cells with equivalent preparations of luciferase plasmid in biological triplicate for each construct and quantified Renilla luciferase expression relative to an independently expressing Firefly luciferase internal control (Figure 1C). Compared with the plasmid with WT PKD1 5′ UTR, ΔuORF1 or ΔuORF2 showed 2.5 fold and 2.3 fold increased Renilla/Firefly expression, respectively, and ΔuORF1&2 showed a 3.8 fold increase (Figure 1D). The Firefly internal control showed highly consistent transfection rates (Supplemental Figure 2). Renilla mRNA expression in biological triplicates showed no difference between WT and ΔuORF constructs consistent with the effect being at the level of protein translation (Figure 1E). RNA secondary structure predictions within the limitations of available programs and input parameters are without apparent change (Supplemental Figure 3) (58–61). Taken together, these data support a 2–4 fold increase in CDS protein expression by genetic edit to remove PKD1 uORF start codons.
PKD1 uORF1 and uORF2 can initiate translation: fusion protein analysis. To confirm the protein translation beginning at uORF1 and uORF2 initiation codons, which is fundamental to the proposed mechanism of effect, we designed a system to overcome the technical challenge of detecting the 5 and 7 amino acid uORF peptides. We edited the uORF stop codons in our PKD1 5′ UTR dual luciferase construct such that the uORF1- and uORF2-initiated peptides extend to be an in-frame fusion protein with approximately 35 kDa Renilla protein (“Fus1,” “Fus2,” respectively). Fus2 required an additional nucleotide to put uORF2 in frame with Renilla, and both constructs had Renilla’s start codon edited to TTG so the Renilla peptide sequence would only be translated if translation initiation occurred from a uORF start codon. Negative control constructs “Fus1-NC” and “Fus2-NC” have the single nucleotide A>T edit compared with their respective fusion construct to lack of that specific uORF’s start codon. Construct sequence is provided in Supplemental Figure 4A and Supplemental Table 1. We transfected independent wells of HEK293 cells with these plasmids and compared Renilla fusion protein expression and migration by Western blot. Anti-Renilla Western blot shows robust translation of uORF1, as represented by the approximately 37 kDa uORF1-Renilla fusion protein expressed from the Fus1 construct, and detectable weak translation of uORF2, as represented by the approximately 36 kDa uORF2-Renilla fusion protein expressed from Fus2, indicated by an asterisk (Figure 1F). Notably, Fus2 also expresses an approximately 42 kDa larger band with stronger expression than uORF2, suggesting additional in-frame translational initiation further upstream in the PKD1 5’ UTR; we investigate this below. Most notably, this experiment confirms strong translation initiation from uORF1 and some from uORF2.
Public datasets support PKD1 uORF translation, and consideration of “uORF3”. Given evidence of additional PKD1 uORF translation from further upstream in the 5′ UTR, we next considered publicly available ribosome profiling (Ribo-seq) data in the Genome Wide Information on Protein Synthesis though visualization of ribosome profiling data (GWIPS-viz) browser (62, 63). Read depth in PKD1 exon 1 is poor and inconsistent across the region, which greatly limits interpretations, nonetheless, there are ribo-seq reads in the human and mouse 5′ UTR, suggesting translation from uORFs with greatest read depth in the region of uORF1 (Supplemental Figure 5). An independent “Ribo-uORF” resource shows 8 datasets supporting PKD1 uORF translation with 11–20 reads each (64, 65). Six out of the 8 datasets support only uORF1 translation initiation, while the 2 others also suggest an upstream CTG-initiated uORF at the c.–161 position or c.–206 position. We named these uORF3 and uORF4, respectively. As uORF3 at c.–161 has the strongest Kozak sequence among the potential uORFs (56) we hypothesized it may also affect CDS translation. However, upon designing and testing a ΔORF3 luciferase construct we found that Renilla/Firefly expression was no different from that of the WT construct (Figure 1G and Supplemental Table 1).
Four PKD1 uORFs translate and affect the use of downstream start codons. The upper band expressed from Fus2 in Figure 1F suggests active translation from at least one uORF upstream of uORF1 and uORF2. We focused on the potential uORFs that would start with CTG (CUG) codon at c.–161 and c.–206 that we define as uORF3 and uORF4, respectively. These are in frame with uORF2 and use its stop codon if translated, and there are no other ATG, CTG, or GTG start codons upstream in the PKD1 5′ UTR. We edited the start codons of uORF3 or uORF4 with or without additional uORF edits in the Fus2 construct to compare the resultant Renilla fusion proteins on Western blot. The Fus2-ΔORF4 and Fus2-ΔORF3 edits reduce expression of the upper and lower components of the 42 kDa wide band expressed by Fus2, thus supporting the proposed start codons and demonstrating active translation from uORF3 and 4 (Supplemental Figure 4, B and C). It is unclear why changing CTG to TTG does not fully abolish uORF4 translation; nonetheless, reducing translation of the most upstream uORF (“uORF4”) results in more apparent translation of the next uORF (“uORF3”) (Supplemental Figure 4C), while reducing translation of both uORF4 and uORF3 increases translation of the next most 5’ uORF, which is uORF1 (Figure 1H, rightmost lane), and following the same 5′ to 3′ order, impairing translation from uORF4, uORF3, and uORF1 maximally increases translation of the final uORF (uORF2, Supplemental Figure 4C, rightmost lane). With this understanding from Fus2 constructs, we made a final set of luciferase constructs to determine the optimal uORF inhibition strategy to maximize CDS translation (Figure 1H).
We conclude that uORF1 translation has the strongest inhibitory effect on CDS protein expression. Upstream uORFs are active; however, their inhibition may only increase uORF1 translation, which is counterproductive. Our data suggest that uORF2 translation may be low at baseline but increases substantially in the setting of inhibition of uORF1 (Supplemental Figure 4C), thus demonstrating a mechanism by which uORF2 inhibition could have additive benefit to uORF1 inhibition alone. We considered whether inhibition of all 4 uORFs or only the most active (uORF4, uORF1, uORF2) would achieve the maximal benefit; yet, we find that there is no added increase over inhibition of just uORF1&2 (Figure 1H). Given that the most relevant human PKD1 uORF1 is in frame with the CDS, we considered whether readthrough of the uORF1 stop codon would be a strategy worth pursuing — with the large caveat that functional testing of a 5′-extended PC1 protein would be necessary, as this may likely affect the PC1 signal peptide and therefore protein maturation and trafficking. We tested a version of our Fus1 model with intact Renilla start codon (“Fus1wRenillaATG”) to compare intensity of translation start from uORF1 versus the CDS start and found that, indeed, uORF1 translates more strongly than the CDS. However, the summative intensity of both bands appeared lower than translation from the CDS start with uORF1&2 inhibition, so we pursued strategies to inhibit translation from uORF1 and uORF2.
ASOs targeting PKD1 uORFs substantially increase CDS protein expression in a sequence-specific manner. We designed 16-nucleotide ASOs and mis-matched controls to block translation initiation from uORF1 or uORF2 in human or mouse based on successful ASO sequence designs for uORF blocking in other genes (66, 67) and chose ASO chemistries used in current FDA-approved therapies with established safety and stability profiles (68). We call these “ASO1,” “ASO2” (Figure 2A), “mASO1,” and “mASO2” (Supplemental Figure 6 and Supplemental Table 2). ASO treatment to HEK293 cells expressing “WT” luciferase plasmid demonstrates increased Renilla luciferase (protein) expression, without affecting Renilla mRNA expression (Figure 2, B and C). ASO-based uORF inhibition was more impactful with ASO1 than ASO2, although modest additive benefit was seen from ASO2. To demonstrate specificity of the ASO1 effect to the uORF translation as opposed to other factors related to mRNA binding, we combined the genetic edit and ASO treatment. We found that ASO1 treatment has no added benefit on a construct that already lacks uORF1 start codon, but can treat the ΔuORF2 construct to achieve protein expression similar to combined ASO1 and ASO2 treatment (Figure 2D). To visualize ASO1’s specific inhibition of uORF1 translation, we applied ASO1 to the uORF1-Renilla fusion protein “Fus1” construct. We found that ASO1 treatment increased translation from the main CDS while it reduced — although not completely — translation initiated at uORF1, as represented by the uORF1-Renilla fusion protein (Figure 2E).
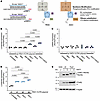 Figure 2
Design and efficacy of antisense oligonucleotides (ASOs) Inhibiting uORF translation to increase protein expression post-transcriptionally. (A) Illustration of the 16-nucleotide ASO sequences complementary to human PKD1 5’ UTR mRNA sequence used in this study. ASO nucleotides are a derivative of RNA with PS linkages and 2’OMe modifications on all nucleotides as highlighted in orange on illustration modified from Roberts et al. (68). (B) Effects of 20 nM ASOs on Renilla/Firefly expression in WT PKD1 5’ UTR dual-luciferase assay assessed after 24 hours of treatment. Mismatched control ASOs (MM1 and MM2) are of identical chemical composition to ASO1 and ASO2 but with every third nucleotide modified. (C) No difference between Renilla/Firefly mRNA expression of the transfected cells treated with or without treatment with ASOs. (D) ASO1 treatment of Luciferase construct variants illustrates that the ASO only has additional benefit when added to the construct that contains the uORF1 initiation codon (WT or DuORF2, but not DuORF1). Data represent 3 independent treatments for each experimental condition. (E) Anti-Renilla immunoblot showing that the effect of ASO1 on protein expression is specific to the location of the protein initiation. As designed, ASO1 indeed inhibits translation initiation from uORF1 (the only initiation codon for Renilla in the uORF1-Renilla fusion protein “Fus1” construct) even though it increases protein translation from the downstream typical ATG initiation codon of Renilla in the WT construct, as identified in this study. One-way ANOVA was applied in B–D. Significant differences are indicated.
Native PKD1 translation is increased with PKD1 uORF-blocking treatment. We next applied ASO1 and ASO2 to culture media of human retinal pigment epithelial (RPE) cells to determine their treatment effect on PC1 protein expression. RPE cells are a well-studied ciliated epithelial cell line chosen for its detectable native PC1 expression levels. Cells treated with ASO1 or ASO2, particularly ASO1 alone, show a strong posttranscriptional increase in PC1 protein (Figure 3, A–C). We confirmed the identity of the most prominent PC1 band as the functionally relevant mature N-terminal fragment (PC1-NTR) by demonstrating a negative control cell line “PKD1-trunc” which lacks the PC1 bands of normal size and showing that the PC1-NTR band is EndoglycosidaseH (EndoH) resistant, a feature achieved when a protein traffics through the middle Golgi (Figure 3B). Given the similarities in human and mouse uORFs and the critical use of mouse models for ADPKD therapeutics, we next tested mouse Pkd1 uORF inhibition on immortalized mouse cell lines of Pkd1 WT or Pkd1 p.R2216W cystogenic missense allele (mouse orthologue of human p.R2220W) with a knocked-in C-terminal V5 tag (38). The PC1 C-terminal fragment (PC1-CTF), which holds onto the mature N-terminal fragment by a noncovalent bond, is an established representation of functional PC1 dosage (12, 18). In both genotypes, treatment with mASO1, mASO2, or the combination shows an increase PC1-CTF, PC1-FL, and PC1-NTR protein, without change in mRNA (Figure 3, D–F). The magnitude of effect on protein synthesis was generally less for the mouse Pkd1 uORF-targeting ASOs compared with those targeting human uORFs, although some experiments showed similar levels of effect (data not shown).
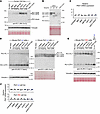 Figure 3
ASOs targeting PKD1 uORFs increase Polycystin-1 protein expression in human and mouse cell lines without affecting mRNA expression. (A) Native PC1 immunoblot (PC1 N-term, 7e12) demonstrates increased PC1 with ASOs targeting PKD1 uORFs in human retinal pigment epithelial (RPE) cells. (B) To confirm the identity of protein bands, protein lysates from RPE cells treated with ASO1 were subsequently treated with Endoglycosidase H (EndoH, “E”), PNGase F (“P”), or buffer only (“n”) before separation on the Tris-Acetate gel and blotting with anti-PC1 N-term antibody 7e12. We created a PKD1-null RPE clonal cell line (frameshift in exon 15) using CRISPR/Cas9 and ran lysates from this cell line (“PKD1 trunc”) in parallel as a negative control for PC1 bands of native size. (C) PKD1 mRNA corresponding to the experiment in A. (D) Anti-V5 immunoblot (left panel) and anti-PC1 N-terminal 7e12 blot (right panel) of lysates from an immortalized mouse cell line with C-terminal V5 tag on wild-type Pkd1 (“Pkd1-wt”) treated with the indicated ASOs targeting mouse Pkd1 5’UTR to inhibit the mouse orthologues of uORF1, uORF2, or both (mASO1, mASO2, or mASO1&2, respectively), or non-targeting mismatch controls (mMM1, mMM2, mMM1&2). (E) Anti-V5 immunoblot of lysates from a similar V5-tagged immortalized mouse cell line with the cleavage-impaired Pkd1 p.R2216W missense variant (orthologue of human PKD1 p.R2220W) (“Pkd1-RW”) treated with the indicated mASOs. Lysate from the Pkd1-wt cell line tested in panel 3D is run on this blot to allow for comparison of the ASO-treated Pkd1-RW PC1-CTF intensity with that of the untreated wild-type cell line. (F) Pkd1 mRNA expression for experiments in D and E. One-way ANOVA was applied in C and F however there are no significant differences.
In vivo role of PKD1 uORFs. To test the role of human PKD1 uORFs in vivo, we used CRISPR/Cas9 to replace the 313-nucleotide 5’ UTR of WT mouse Pkd1-V5(38) with the 209-nucleotide human PKD1 5’ UTR with or without the 2 A>T single nucleotide edits to remove uORF1 and uORF2 start codons (Figure 4A). The resultant alleles bred to homozygosity produce healthy WT mice of confirmed sequence (Figure 4B). We predicted that the mice without PKD1 uORF1&2 start codons (Pkd1ΔH/ΔH) would have higher PC1 protein expression than mice with WT PKD1 uORFs (Pkd1H/H) throughout the body. Native PC1 expression is known to be challenging to detect but is highest in lung tissue. Anti-V5 immunoblot on lung tissue supports increased PC1 expression in Pkd1ΔH/ΔH mice (Figure 4C). To best characterize the effect of this allele in the kidney, we cultured primary cells from postnatal day 9 (P9) mouse kidney in epithelial cell–promoting media. Figure 4D shows that expression of PC1 was similar between alleles with mouse (Pkd1WT/WT) or human (Pkd1H/H) WT 5′ UTR, but markedly higher — both in total and cleaved PC1 by C-terminal and N-terminal blots — when uORFs were edited (Pkd1ΔH/ΔH). Further, Pkd1H/H primary cells treated with our on-target ASOs showed a clear increase in PC1-CTF (Figure 4E).
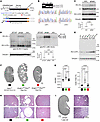 Figure 4
Humanized PKD1 5′UTR mouse model with or without PKD1 uORFs. (A) Illustration of endogenous wild-type mouse Pkd1 locus with previously knocked-in c-terminal V5 epitope undergoing CRISPR/Cas9-mediated replacement of the mouse 5′UTR with human wild-type or DuORF1&2 PKD1 5′UTR to make the “H” and “DH” alleles for this study. (B) Agarose gel electrophoresis illustrating the expected size difference of PCR amplicons between endogenous mouse Pkd1 upstream-forward and exon 1-reverse primer pair. Sanger sequencing from homozygous mice with humanized 5′UTR alleles illustrates the two single nucleotides differences (the A>T in uORF1 and uORF2 start codons) which are the only differences between the H and DH alleles. (C) Anti-V5 immunoblot of P6 lung tissue lysate from H/H and DH/DH mice. NS, nonspecific band present using the rabbit host anti-V5 antibody optimal for tissue lysate. This band is no longer present when the immunoblot is preceded by anti-V5 immunoprecipitation (data not shown). (D) Anti-V5 (left panel) and anti-PC1 (N-term, 7e12, right panel) immunoblot of kidney primary cell lysate from the indicated genotypes. Vinculin denominator from lane 7 was used as denominator for all H/H sample quantification because Ponceau stain indicated equal loading. (E) Anti-V5 immunoblot of H/H primary cell lysate following 72 hours of treatment with the indicated human PKD1 uORF-targeting ASOs. (F–H) Kidney histology scans, KW:BW, cystic index, and representative histology sections from 9-week-old mice. The cohort indicated by the black label are Pkd1 heterozygous mice with Dnajb11fl/fl that lack Cre and therefore are noncystic controls (Pkd1H/– in F and H, and combined Pkd1H/– or Pkd1DH/– in G. (I) Representative kidney histology of DH/DH mice aged to 1 year. Filled circle, male; empty circle, female. Additional data in Supplemental Figures 7 and 8. Two-tailed t test was applied in C, 1-way ANOVA was applied in D and G. Significant differences are indicated.
PKD1 uORF-blocking genetic edit rescues dosage-sensitive cysts: proof of concept for uORFs as a therapeutic target. Orthologous mouse models for ADPKD require biallelic mutation of the disease gene. We have recently characterized a Pkd1 dosage–sensitive mouse model using the human ADPKD minor disease gene DNAJB11 (19, 69). Dnajb11 loss results in inefficient maturation of PC1 protein in the endoplasmic reticulum, resulting in cysts when the functional dosage of PC1 falls below a cystogenic threshold despite a WT Pkd1 gene. Dnajb11fl/fl, with the distal-nephron Ksp(Cdh19) Cre is a model of dosage-sensitive cysts: Dnajb11fl/fl;Pkd1+/–;Ksp-cre is cystic, whereas Dnajb11fl/fl;Ksp-cre, which is Pkd1+/+ is not (69). For this study, we first confirmed that, indeed, the humanization of the Pkd1 5′ UTR did not change the model. We found that, while Dnajb11fl/fl;Pkd1H/–;Ksp-cre mice have a characteristic cystic phenotype, Dnajb11fl/fl;Pkd1ΔH/–;Ksp-cre mice appear entirely rescued from cyst formation (Figure 4, F–H, and Supplemental Figure 7), consistent with a greater than or equal to 2 fold increase in PC1 expression demonstrated from the Pkd1ΔH allele relative to Pkd1H. Of note, the breeding strategy allowed the represented genotypes to be litter mates.
PKD1 uORF inhibition across the lifespan. We hypothesize that the tiny 7 and 5 amino acid peptides translated from PKD1 uORF1 and uORF2 do not themselves have a functional role; rather, the impact of PKD1 uORFs is due to their effect on the availability of ribosomes for the translation of the PC1 coding sequence. To lend support for this hypothesis, we aged male and female Pkd1ΔH/ΔH mice — which would lack these uORF peptides and have the influence of uORF inhibition on PC1 expression throughout their life — to 1 year of age before sacrifice. Mice at this age appeared healthy, and, upon, sacrifice had normal kidney histology; kidney function is normal (Figure 4I and Supplemental Figure 8).
Humanized PKD1 5′ UTR genetic edits on the Pkd1RW missense allele. To test the impact of the uORF-edited PKD1 5’ UTR on a relatively rapid Pkd1 missense cystic kidney model, we generated H or ΔH humanized 5’ UTR alleles with the Pkd1 p.R2216W (orthologue of human PKD1 p.R2220W) missense variant (38). We call these alleles “Pkd1H-RW” and “Pkd1ΔH-RW” (Figure 5A). The Pkd1RW missense variant expresses reduced mature PC1-CTF protein due to impaired PC1 cleavage, as evidenced by an elevated PC1-FL–to–PC1-CTF ratio. After confirming founders for our humanized 5′ UTR Pkd1RW alleles and breeding to homozygosity, we tested PC1 expression in Pkd1H/H, Pkd1H-RW/H-RW, and Pkd1ΔH-RW/ΔH-RW primary cells. As expected, the alleles with the p.R2216W missense variant show reduced PC1-CTF with elevated PC1-FL:PC1-CTF ratio indicating impaired cleavage (Figure 5A). Nonetheless, the allele with ΔuORF1&2 (“ΔH-RW”) achieves cleaved PC1 (PC1-CTF) levels at least equivalent to those from WT Pkd1 by increasing overall expression (Figure 5A). This illustrates the mechanism by which therapeutic rescue is expected from uORF blocking for missense alleles that are functionally insufficient due to impaired biogenesis. Indeed, our limited assessment of recessive mice (Pkd1H-RW/H-RW and Pkd1ΔH-RW/ΔH-RW) shows dramatic rescue of the cystic kidney phenotype and lifespan from the ΔuORF edit (Supplemental Figure 9). Because of variable phenotype and survival that comes with in utero insufficiency of PC1 dosage, we chose to characterize conditional models of our Pkd1RW alleles.
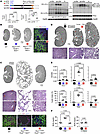 Figure 5
PKD1 ΔuORF1&2 rescues cystic kidney models from the Pkd1RW missense allele. (A) Illustration of the humanized PKD1 WT or ΔuORF1&2 5′UTR generated in this study on a Pkd1-V5 p.R2216W allele (orthologue of human p.R2220W). Anti-V5 immunoblot (center panel) and anti-PC1 (N-term, 7e12, right panel) immunoblot on P9 kidney primary cell lysate. Quantification is by densitometry of PC1-CTF and PC1-FL/Hsp90 on the anti-V5 blot. (B) Kidney histology and fluorescence imaging on kidney sections from mice of the indicated genotypes sacrificed at P14. (C) Kidney histology and fluorescence imaging from mice at P28. The black box indicates the region amplified in the higher power image. (D) Kidney histology from mice at 8 weeks of age. (E) KW-to-BW ratio and cystic index parameters from mice of the indicated genotypes sacrificed at age P14, P28, and 8 weeks. Y-axis labeling for the left panel applies across center and right panels for each parameter to allow comparisons across time points. (F) Blood urea nitrogen levels from mice of the indicated genotypes and time points. Filled circle, male; empty circle, female. Additional data are provided in Supplemental Figures 10–12. One-way ANOVA was applied in A, E, and F and 2-tailed t test for 8-week analyses in E and F. Significant differences are indicated.
Increased PC1 expression from ΔuORF1&2 edits rescues the Pkd1RW allele. We induced Pkd1H-RW/fl or Pkd1ΔH-RW/fl mice carrying single copy Pax8rtTA;TetO-Cre alleles from P0–P14 with doxycycline water to their nursing mothers, and sacrificed mice at P14 or P28 (4 weeks). In the first month of life, Pkd1H-RW/fl mice have progressive cystic kidney disease resulting in large kidneys and markedly reduced renal function, while Pkd1ΔH-RW/fl mice have only small cysts or tubule dilation and still preserved kidney size and function (Figure 5, B–F, and Supplemental Figures 10 and 11). At P14 the small cysts are of both proximal and distal nephron origin, whereas the most rapid cyst growth in the Pkd1H-RW/fl mouse from P14 to P28 is in the distal nephron (Figure 5, B and C). We aged an additional cohort of the mice lacking uORFs (Pkd1ΔH-RW/fl) to 8 weeks, beyond the lifespan of the fully cystic (Pkd1H-RW/fl) mice to assess durability of the rescue (Figure 5D and Supplemental Figure 12). KW:BW and cystic index in 8-week Pkd1ΔH-RW/fl mice suggest mild progression from 4–8 weeks; histology shows this is driven by focal small cysts and — particularly in males — further tubule dilation (Figure 5, D and E). Nonetheless, mean KW:BW and cystic index in 8-week Pkd1ΔH-RW/fl mice remain closer to the mean values of WT than 4-week Pkd1H-RW/fl genotype, and these 8-week Pkd1ΔH-RW/fl mice maintained normal kidney function as assessed by BUN (Figure 5, D–F). The increased severity in males versus females is a feature of all Pax8rtTA;TetO-Cre Pkd1 models at adult time points in our experience not specific to uORF-edited rescue. Overall, these data support 2 key findings: (a) the Pkd1 p.R2216W missense allele can be functionally rescued by increasing its expression; this rescue is lasting but not complete as slowly growing cysts are present, (b) PKD1 uORF inhibition can have dramatic therapeutic effect on at least certain cystogenic PKD1 missense alleles.
-
Discussion
We present the identification and validation of translationally active uORFs in the 5′ UTR of the WT PKD1 gene in humans and other mammalian species. The translation of “uORF1” (PKD1 c.–87 through –64) and “uORF2” (PKD1 c.–20 through –3) negatively impacts Polycystin-1 protein translation from available PKD1 mRNA thereby contributing to the low basal levels of PC1 expression. Genetic edits or steric blocking to prevent the translation of these inhibitory uORFs provide a unique means to increase WT PKD1 expression at the posttranscriptional level (Figure 6).
 Figure 6
Protein translation from PKD1 mRNA. Illustration of ribosome scanning, assembly, and reassembly along the 5′ UTR, showing the proposed mechanism by which PKD1 uORF1 and uORF2 regulate Polycystin-1 protein expression. Scanning of the 40S ribosomal subunit begins at the mRNA 5′ cap and moves in the 5′→3′ direction looking for a start codon (green flag) in the sequence and structural context to initiate translation. When it reaches such a start codon, the 60S ribosomal subunit and other proteins (not shown) composing the translation initiation complex (TIC) assemble and begin protein translation. Upon reaching a stop codon, the TIC with 60S subunit disassembles from the 40s subunit. (A) In WT PKD1 mRNA, our data suggest efficient translation of uORF1 (pink arrow). Given the effect on Polycystin-1 expression, we propose that scanning 40S subunits may often stall or dissociate after uORF1 translation (*) therefore reducing the occurrence of a scanning 40S ribosome getting past this to reach the coding sequence. Our data suggest that PKD1 uORF2 does not translate as robustly as uORF1, nonetheless its stop codon is only separated from the CDS start by 2 nucleotides, so reassembly (**) of the TIC prior to CDS start may be particularly challenged. (B) Genetic edits (2 single nucleotide substitutions) at uORF start codons prevent initiation at uORF1 and uORF2, blocking their translation and thereby increasing ribosome availability for initiation at the downstream Polycystin-1 coding sequence. This study modeled these edits in mouse models and luciferase constructs. (C) Sterically blocking the uORF start sites with antisense oligonucleotides (ASOs) as the 40S ribosomal subunit scans across the 5′ UTR similarly impairs translation of uORF1 and uORF2. In both uORF-blocking strategies, loss of uORF translation enhances formation of the initiation complex at the main ORF and increases Polycystin-1 protein synthesis (orange arrow).
PKD1 uORF-blocking exerts a sequence-specific effect to increase PC1 protein that is independent from other approaches, such as miR-17 inhibition, which increases PKD1 mRNA, or from folding correctors or chaperones, which aim to increase functional protein. The robust effect in preventing or minimizing cyst burden in our models illustrates the direct relationship between PC1 functional expression level and cystogenic threshold. Our Pkd1RW model (orthologue of human p.R2220W) has not been studied as extensively as the commonly studied Pkd1RC (orthologue of human p.R3277C) mouse model; the Pkd1RW has a more severe defect in PC1 cleavage based on published Western blot data and resultantly has a more severe phenotype in recessive and conditional models, as has been reported in the literature (31, 38). Our data show that the Pkd1RW allele can be rescued with quantitative increase alone. Importantly, while quantitative increase has a profound benefit for hypomorphic Pkd1 alleles, mice living with only a single upregulated Pkd1RW allele (Pkd1ΔH-RW/fl genotype) do develop mild cystic phenotype that progresses over time, reminding us that the degree of benefit for individual pathogenic missense variants will vary depending on the quantitative versus functional deficit of the allele. The strong efficacy of uORF inhibition in the Dnajb11 model supports the applicability of this strategy in models of PC1 biogenesis defects, such as the cysts in ADPKD-DNAJB11 where WT Pkd1 alleles are present for quantitative increase in expression.
A study published in 2006 implicated that overexpression of WT PKD1 by 2–15 fold in the form of a BAC transgene caused cysts, lending pause to therapeutic approaches to over express the gene (70). Nonetheless, other models with increased copy number of WT Pkd1 have not described cysts attributable to PC1 overexpression and suggest that preserving Pkd1’s endogenous upstream regulatory sequence is an important consideration (12, 71). The normal phenotype of our PKD1 uORF–edited models across the lifespan lends further support for the safety of at least modest increase in PC1 expression. Any mutation-agnostic approach that increases protein expression from endogenous alleles in monogenic diseases may increase expression of the pathogenic allele. Fortunately for the safety of this approach in ADPKD, PKD1 pathogenic alleles are functionally or quantitatively insufficient, without any reported alleles or phenotypes with gain of function. Truncated alleles may undergo nonsense mediated decay to varying extents. Further, the low basal expression levels of PC1 ensure that a 2–4 fold increase still is not a highly expressed protein. This is in stark contrast to the UMOD and MUC1 genes, which are highly expressed in the kidney and for which specific mutations cause ER stress and autosomal dominant tubulointerstitial kidney disease (ADTKD). From experience and additional testing with the humanized alleles, we do not see overt ER stress in the Pkd1RW genotype with or without humanized UTR nor from its upregulation in the uORF-edited alleles (Supplemental Figure 9D). These factors make PKD1 a good candidate for safe upregulation.
Characterization of PKD1 uORFs lends insight into the interpretation of rare human variants in the PKD1 5’ UTR. PKD1 uORFs have recently been independently investigated using luciferase assays by two other groups, and these analyses provide support to our conclusions (72, 73). Each group found an additive effect of editing both uORF1 and uORF2 in luciferase expression. Our study extends the analysis of PKD1 uORF inhibition to assessment of endogenous Polycystin-1 protein, informs the context of additional upstream uORF translation, and defines successful uORF-blocking ASO sequences. Our ASO studies showed equivalent benefit from single uORF blockade as combination treatment when assessing Polycystin-1 protein itself. One of these published studies implicated what we believe is the first recognized ADPKD disease-causing variant in the PKD1 5′ UTR. The patient’s variant, a single nucleotide insertion in uORF1, shifts the reading frame such that uORF1 doesn’t reach a stop codon until after the Polycystin-1 CDS start (73). The pathogenicity of this human variant emphasizes the functional importance of PKD1 uORFs in humans. Our investigation of alternative PKD1 5’ UTR sequences affecting uORFs was not aimed at particular human PKD1 variants but supports that the termination of uORF1 — initiating at c.–87 and terminating with the stop codon at c.–64 through–66 in WT sequence — prior to CDS start is important to allow sufficient translation at the PKD1/Polycystin-1 coding sequence ATG start codon at c.1 (Figure 1H, right-most 2 lanes). Our data illustrate the consequence of PKD1 uORF1 stop loss — without frameshift — in “Fus1wRenillaATG,” which models the proposed effect from a stop codon readthrough compound or a rare variant to the uORF1 stop codon. This shows protein expression at approximately WT levels of a uORF1-CDS fusion protein, though it remains to be seen whether such an N-terminal extension of 29 amino acids to Polycystin-1 would be functional or would have impaired trafficking and maturation and be pathogenic. Finally, while such an occurrence would be exceedingly rare to occur in a patient with ADPKD, our data suggest that a rare variant abolishing the start codon of uORF1 or uORF2 on an otherwise WT PKD1 allele would be proposed to raise PC1 dosage and may confer relative protection against PC1 dosage-dependent mechanisms in patients with ADPKD or ADPLD.
Our investigation of PKD1 uORFs may lend a framework and valuable insights into the understanding and investigation of uORFs for other genes. Our sequential investigation of upstream uORF translation from non-AUG start codons — both CTG (CUG) in this case — illustrates mechanistic principles of uORF regulation, including that (a) the 5’ to 3’ order of translating uORFs is relevant to their consequence on each other’s translational activity, (b) factors beyond Kozak sequence influence translational activity from each uORF, and (c) factors beyond just the location of the uORF stop codon relative to the coding sequence modulate the impact of uORFs on CDS protein expression. Our data, supported by the implicated human pathogenic variant (73), suggest that the most severe effect is when highly expressed uORFs have no in-frame stop codon prior to the coding sequence — although consideration should be given to whether the uORF is in frame with the coding sequence.
In summary, our studies establish a role for human PKD1 uORFs in the steady-state protein levels of Polycystin-1 in the kidney with a magnitude of effect highly impactful in dosage-dependent models of polycystic kidney disease. We show that steric inhibition of PKD1 uORFs using an ASO is an effective approach to increase Polycystin-1 protein. We therefore propose that therapeutically targeting PKD1 uORFs may offer modest to dramatic effects, depending on the germline and somatic variants in the kidney cysts of patients with ADPKD.


Copyright © 2026 American Society for Clinical Investigation
ISSN: 0021-9738 (print), 1558-8238 (online)