
Advertisement
Research ArticleHematologyInflammationOncology
Open Access |  10.1172/JCI202856
Targeting GLP-1R and IL-17A suppresses obesity-induced leukemia in an oncogenic PTPN11 mutation–driven model
Reuben Kapur,1 Linke Li,2,3 Rahul Kanumuri,1 Kanaka Sai Ram Padam,1 Baskar Ramdas,1 Chiranjeevi Pasala,4 Gabriela Chiosis,4 Lakshmi Reddy Palam,1 Ramesh Kumar,1 Satoshi Koyama,2,3 Pradeep Natarajan,3,5,6 Laura S. Haneline,1 Zhi Yu,2,3,6 and Santhosh Kumar Pasupuleti1
1Herman B Wells Center for Pediatric Research, Department of Pediatrics, Indiana University School of Medicine (IUSM), Indianapolis, Indiana, USA.
2Clinical and Translational Epidemiology Unit, Massachusetts General Hospital, Boston, Massachusetts, USA.
3Program in Medical and Population Genetics and the Cardiovascular Disease Initiative, Broad Institute of Harvard and MIT, Cambridge, Massachusetts, USA.
4Chemical Biology Program, Memorial Sloan Kettering Cancer Center, New York, New York, USA.
5Cardiovascular Research Center, Massachusetts General Hospital, Boston, Massachusetts, USA.
6Department of Medicine, Harvard Medical School, Boston, Massachusetts, USA.
Address correspondence to: Santhosh Kumar Pasupuleti, Assistant Research Professor of Pediatrics, Herman B Wells Center for Pediatric Research, Indiana University School of Medicine, 1044 W. Walnut Street, R4-169, Indianapolis, Indiana, 46202, USA. Phone: 317.274.0303; Email: skpasupu@iu.edu. Or to: Zhi Yu, Assistant Professor, Clinical and Translational Epidemiology Unit, Massachusetts General Hospital, 100 Cambridge Street, Office 1576, Boston, Massachusetts, 02114, USA. Phone: 603.749.6686; Email: zyu@broadinstitute.org. Or to: Reuben Kapur, Professor of Pediatrics, Herman B Wells Center for Pediatric Research, Indiana University School of Medicine, 1044 W. Walnut Street, R4-168, Indianapolis, Indiana, 46202, USA. Phone: 317.274.4658; Email: rkapur@iu.edu. Or to: Laura S. Haneline, Professor of Pediatrics, Microbiology and Immunology, Herman B Wells Center for Pediatric Research, Indiana University School of Medicine, 699 Riley Hospital Drive, RR 208, Indianapolis, Indiana, 46202, USA. Phone: 317.274.4716; Email: lhanelin@iu.edu.
Authorship note: R Kapur, LL, and R Kanumuri are co–first authors. ZY and SKP are co–senior authors.
Find articles by Kapur, R. in: PubMed | Google Scholar
1Herman B Wells Center for Pediatric Research, Department of Pediatrics, Indiana University School of Medicine (IUSM), Indianapolis, Indiana, USA.
2Clinical and Translational Epidemiology Unit, Massachusetts General Hospital, Boston, Massachusetts, USA.
3Program in Medical and Population Genetics and the Cardiovascular Disease Initiative, Broad Institute of Harvard and MIT, Cambridge, Massachusetts, USA.
4Chemical Biology Program, Memorial Sloan Kettering Cancer Center, New York, New York, USA.
5Cardiovascular Research Center, Massachusetts General Hospital, Boston, Massachusetts, USA.
6Department of Medicine, Harvard Medical School, Boston, Massachusetts, USA.
Address correspondence to: Santhosh Kumar Pasupuleti, Assistant Research Professor of Pediatrics, Herman B Wells Center for Pediatric Research, Indiana University School of Medicine, 1044 W. Walnut Street, R4-169, Indianapolis, Indiana, 46202, USA. Phone: 317.274.0303; Email: skpasupu@iu.edu. Or to: Zhi Yu, Assistant Professor, Clinical and Translational Epidemiology Unit, Massachusetts General Hospital, 100 Cambridge Street, Office 1576, Boston, Massachusetts, 02114, USA. Phone: 603.749.6686; Email: zyu@broadinstitute.org. Or to: Reuben Kapur, Professor of Pediatrics, Herman B Wells Center for Pediatric Research, Indiana University School of Medicine, 1044 W. Walnut Street, R4-168, Indianapolis, Indiana, 46202, USA. Phone: 317.274.4658; Email: rkapur@iu.edu. Or to: Laura S. Haneline, Professor of Pediatrics, Microbiology and Immunology, Herman B Wells Center for Pediatric Research, Indiana University School of Medicine, 699 Riley Hospital Drive, RR 208, Indianapolis, Indiana, 46202, USA. Phone: 317.274.4716; Email: lhanelin@iu.edu.
Authorship note: R Kapur, LL, and R Kanumuri are co–first authors. ZY and SKP are co–senior authors.
Find articles by Li, L. in: PubMed | Google Scholar
1Herman B Wells Center for Pediatric Research, Department of Pediatrics, Indiana University School of Medicine (IUSM), Indianapolis, Indiana, USA.
2Clinical and Translational Epidemiology Unit, Massachusetts General Hospital, Boston, Massachusetts, USA.
3Program in Medical and Population Genetics and the Cardiovascular Disease Initiative, Broad Institute of Harvard and MIT, Cambridge, Massachusetts, USA.
4Chemical Biology Program, Memorial Sloan Kettering Cancer Center, New York, New York, USA.
5Cardiovascular Research Center, Massachusetts General Hospital, Boston, Massachusetts, USA.
6Department of Medicine, Harvard Medical School, Boston, Massachusetts, USA.
Address correspondence to: Santhosh Kumar Pasupuleti, Assistant Research Professor of Pediatrics, Herman B Wells Center for Pediatric Research, Indiana University School of Medicine, 1044 W. Walnut Street, R4-169, Indianapolis, Indiana, 46202, USA. Phone: 317.274.0303; Email: skpasupu@iu.edu. Or to: Zhi Yu, Assistant Professor, Clinical and Translational Epidemiology Unit, Massachusetts General Hospital, 100 Cambridge Street, Office 1576, Boston, Massachusetts, 02114, USA. Phone: 603.749.6686; Email: zyu@broadinstitute.org. Or to: Reuben Kapur, Professor of Pediatrics, Herman B Wells Center for Pediatric Research, Indiana University School of Medicine, 1044 W. Walnut Street, R4-168, Indianapolis, Indiana, 46202, USA. Phone: 317.274.4658; Email: rkapur@iu.edu. Or to: Laura S. Haneline, Professor of Pediatrics, Microbiology and Immunology, Herman B Wells Center for Pediatric Research, Indiana University School of Medicine, 699 Riley Hospital Drive, RR 208, Indianapolis, Indiana, 46202, USA. Phone: 317.274.4716; Email: lhanelin@iu.edu.
Authorship note: R Kapur, LL, and R Kanumuri are co–first authors. ZY and SKP are co–senior authors.
Find articles by
Kanumuri, R.
in:
PubMed
|
Google Scholar
|

1Herman B Wells Center for Pediatric Research, Department of Pediatrics, Indiana University School of Medicine (IUSM), Indianapolis, Indiana, USA.
2Clinical and Translational Epidemiology Unit, Massachusetts General Hospital, Boston, Massachusetts, USA.
3Program in Medical and Population Genetics and the Cardiovascular Disease Initiative, Broad Institute of Harvard and MIT, Cambridge, Massachusetts, USA.
4Chemical Biology Program, Memorial Sloan Kettering Cancer Center, New York, New York, USA.
5Cardiovascular Research Center, Massachusetts General Hospital, Boston, Massachusetts, USA.
6Department of Medicine, Harvard Medical School, Boston, Massachusetts, USA.
Address correspondence to: Santhosh Kumar Pasupuleti, Assistant Research Professor of Pediatrics, Herman B Wells Center for Pediatric Research, Indiana University School of Medicine, 1044 W. Walnut Street, R4-169, Indianapolis, Indiana, 46202, USA. Phone: 317.274.0303; Email: skpasupu@iu.edu. Or to: Zhi Yu, Assistant Professor, Clinical and Translational Epidemiology Unit, Massachusetts General Hospital, 100 Cambridge Street, Office 1576, Boston, Massachusetts, 02114, USA. Phone: 603.749.6686; Email: zyu@broadinstitute.org. Or to: Reuben Kapur, Professor of Pediatrics, Herman B Wells Center for Pediatric Research, Indiana University School of Medicine, 1044 W. Walnut Street, R4-168, Indianapolis, Indiana, 46202, USA. Phone: 317.274.4658; Email: rkapur@iu.edu. Or to: Laura S. Haneline, Professor of Pediatrics, Microbiology and Immunology, Herman B Wells Center for Pediatric Research, Indiana University School of Medicine, 699 Riley Hospital Drive, RR 208, Indianapolis, Indiana, 46202, USA. Phone: 317.274.4716; Email: lhanelin@iu.edu.
Authorship note: R Kapur, LL, and R Kanumuri are co–first authors. ZY and SKP are co–senior authors.
Find articles by Padam, K. in: PubMed | Google Scholar
1Herman B Wells Center for Pediatric Research, Department of Pediatrics, Indiana University School of Medicine (IUSM), Indianapolis, Indiana, USA.
2Clinical and Translational Epidemiology Unit, Massachusetts General Hospital, Boston, Massachusetts, USA.
3Program in Medical and Population Genetics and the Cardiovascular Disease Initiative, Broad Institute of Harvard and MIT, Cambridge, Massachusetts, USA.
4Chemical Biology Program, Memorial Sloan Kettering Cancer Center, New York, New York, USA.
5Cardiovascular Research Center, Massachusetts General Hospital, Boston, Massachusetts, USA.
6Department of Medicine, Harvard Medical School, Boston, Massachusetts, USA.
Address correspondence to: Santhosh Kumar Pasupuleti, Assistant Research Professor of Pediatrics, Herman B Wells Center for Pediatric Research, Indiana University School of Medicine, 1044 W. Walnut Street, R4-169, Indianapolis, Indiana, 46202, USA. Phone: 317.274.0303; Email: skpasupu@iu.edu. Or to: Zhi Yu, Assistant Professor, Clinical and Translational Epidemiology Unit, Massachusetts General Hospital, 100 Cambridge Street, Office 1576, Boston, Massachusetts, 02114, USA. Phone: 603.749.6686; Email: zyu@broadinstitute.org. Or to: Reuben Kapur, Professor of Pediatrics, Herman B Wells Center for Pediatric Research, Indiana University School of Medicine, 1044 W. Walnut Street, R4-168, Indianapolis, Indiana, 46202, USA. Phone: 317.274.4658; Email: rkapur@iu.edu. Or to: Laura S. Haneline, Professor of Pediatrics, Microbiology and Immunology, Herman B Wells Center for Pediatric Research, Indiana University School of Medicine, 699 Riley Hospital Drive, RR 208, Indianapolis, Indiana, 46202, USA. Phone: 317.274.4716; Email: lhanelin@iu.edu.
Authorship note: R Kapur, LL, and R Kanumuri are co–first authors. ZY and SKP are co–senior authors.
Find articles by Ramdas, B. in: PubMed | Google Scholar
1Herman B Wells Center for Pediatric Research, Department of Pediatrics, Indiana University School of Medicine (IUSM), Indianapolis, Indiana, USA.
2Clinical and Translational Epidemiology Unit, Massachusetts General Hospital, Boston, Massachusetts, USA.
3Program in Medical and Population Genetics and the Cardiovascular Disease Initiative, Broad Institute of Harvard and MIT, Cambridge, Massachusetts, USA.
4Chemical Biology Program, Memorial Sloan Kettering Cancer Center, New York, New York, USA.
5Cardiovascular Research Center, Massachusetts General Hospital, Boston, Massachusetts, USA.
6Department of Medicine, Harvard Medical School, Boston, Massachusetts, USA.
Address correspondence to: Santhosh Kumar Pasupuleti, Assistant Research Professor of Pediatrics, Herman B Wells Center for Pediatric Research, Indiana University School of Medicine, 1044 W. Walnut Street, R4-169, Indianapolis, Indiana, 46202, USA. Phone: 317.274.0303; Email: skpasupu@iu.edu. Or to: Zhi Yu, Assistant Professor, Clinical and Translational Epidemiology Unit, Massachusetts General Hospital, 100 Cambridge Street, Office 1576, Boston, Massachusetts, 02114, USA. Phone: 603.749.6686; Email: zyu@broadinstitute.org. Or to: Reuben Kapur, Professor of Pediatrics, Herman B Wells Center for Pediatric Research, Indiana University School of Medicine, 1044 W. Walnut Street, R4-168, Indianapolis, Indiana, 46202, USA. Phone: 317.274.4658; Email: rkapur@iu.edu. Or to: Laura S. Haneline, Professor of Pediatrics, Microbiology and Immunology, Herman B Wells Center for Pediatric Research, Indiana University School of Medicine, 699 Riley Hospital Drive, RR 208, Indianapolis, Indiana, 46202, USA. Phone: 317.274.4716; Email: lhanelin@iu.edu.
Authorship note: R Kapur, LL, and R Kanumuri are co–first authors. ZY and SKP are co–senior authors.
Find articles by Pasala, C. in: PubMed | Google Scholar
1Herman B Wells Center for Pediatric Research, Department of Pediatrics, Indiana University School of Medicine (IUSM), Indianapolis, Indiana, USA.
2Clinical and Translational Epidemiology Unit, Massachusetts General Hospital, Boston, Massachusetts, USA.
3Program in Medical and Population Genetics and the Cardiovascular Disease Initiative, Broad Institute of Harvard and MIT, Cambridge, Massachusetts, USA.
4Chemical Biology Program, Memorial Sloan Kettering Cancer Center, New York, New York, USA.
5Cardiovascular Research Center, Massachusetts General Hospital, Boston, Massachusetts, USA.
6Department of Medicine, Harvard Medical School, Boston, Massachusetts, USA.
Address correspondence to: Santhosh Kumar Pasupuleti, Assistant Research Professor of Pediatrics, Herman B Wells Center for Pediatric Research, Indiana University School of Medicine, 1044 W. Walnut Street, R4-169, Indianapolis, Indiana, 46202, USA. Phone: 317.274.0303; Email: skpasupu@iu.edu. Or to: Zhi Yu, Assistant Professor, Clinical and Translational Epidemiology Unit, Massachusetts General Hospital, 100 Cambridge Street, Office 1576, Boston, Massachusetts, 02114, USA. Phone: 603.749.6686; Email: zyu@broadinstitute.org. Or to: Reuben Kapur, Professor of Pediatrics, Herman B Wells Center for Pediatric Research, Indiana University School of Medicine, 1044 W. Walnut Street, R4-168, Indianapolis, Indiana, 46202, USA. Phone: 317.274.4658; Email: rkapur@iu.edu. Or to: Laura S. Haneline, Professor of Pediatrics, Microbiology and Immunology, Herman B Wells Center for Pediatric Research, Indiana University School of Medicine, 699 Riley Hospital Drive, RR 208, Indianapolis, Indiana, 46202, USA. Phone: 317.274.4716; Email: lhanelin@iu.edu.
Authorship note: R Kapur, LL, and R Kanumuri are co–first authors. ZY and SKP are co–senior authors.
Find articles by Chiosis, G. in: PubMed | Google Scholar
1Herman B Wells Center for Pediatric Research, Department of Pediatrics, Indiana University School of Medicine (IUSM), Indianapolis, Indiana, USA.
2Clinical and Translational Epidemiology Unit, Massachusetts General Hospital, Boston, Massachusetts, USA.
3Program in Medical and Population Genetics and the Cardiovascular Disease Initiative, Broad Institute of Harvard and MIT, Cambridge, Massachusetts, USA.
4Chemical Biology Program, Memorial Sloan Kettering Cancer Center, New York, New York, USA.
5Cardiovascular Research Center, Massachusetts General Hospital, Boston, Massachusetts, USA.
6Department of Medicine, Harvard Medical School, Boston, Massachusetts, USA.
Address correspondence to: Santhosh Kumar Pasupuleti, Assistant Research Professor of Pediatrics, Herman B Wells Center for Pediatric Research, Indiana University School of Medicine, 1044 W. Walnut Street, R4-169, Indianapolis, Indiana, 46202, USA. Phone: 317.274.0303; Email: skpasupu@iu.edu. Or to: Zhi Yu, Assistant Professor, Clinical and Translational Epidemiology Unit, Massachusetts General Hospital, 100 Cambridge Street, Office 1576, Boston, Massachusetts, 02114, USA. Phone: 603.749.6686; Email: zyu@broadinstitute.org. Or to: Reuben Kapur, Professor of Pediatrics, Herman B Wells Center for Pediatric Research, Indiana University School of Medicine, 1044 W. Walnut Street, R4-168, Indianapolis, Indiana, 46202, USA. Phone: 317.274.4658; Email: rkapur@iu.edu. Or to: Laura S. Haneline, Professor of Pediatrics, Microbiology and Immunology, Herman B Wells Center for Pediatric Research, Indiana University School of Medicine, 699 Riley Hospital Drive, RR 208, Indianapolis, Indiana, 46202, USA. Phone: 317.274.4716; Email: lhanelin@iu.edu.
Authorship note: R Kapur, LL, and R Kanumuri are co–first authors. ZY and SKP are co–senior authors.
Find articles by Palam, L. in: PubMed | Google Scholar
1Herman B Wells Center for Pediatric Research, Department of Pediatrics, Indiana University School of Medicine (IUSM), Indianapolis, Indiana, USA.
2Clinical and Translational Epidemiology Unit, Massachusetts General Hospital, Boston, Massachusetts, USA.
3Program in Medical and Population Genetics and the Cardiovascular Disease Initiative, Broad Institute of Harvard and MIT, Cambridge, Massachusetts, USA.
4Chemical Biology Program, Memorial Sloan Kettering Cancer Center, New York, New York, USA.
5Cardiovascular Research Center, Massachusetts General Hospital, Boston, Massachusetts, USA.
6Department of Medicine, Harvard Medical School, Boston, Massachusetts, USA.
Address correspondence to: Santhosh Kumar Pasupuleti, Assistant Research Professor of Pediatrics, Herman B Wells Center for Pediatric Research, Indiana University School of Medicine, 1044 W. Walnut Street, R4-169, Indianapolis, Indiana, 46202, USA. Phone: 317.274.0303; Email: skpasupu@iu.edu. Or to: Zhi Yu, Assistant Professor, Clinical and Translational Epidemiology Unit, Massachusetts General Hospital, 100 Cambridge Street, Office 1576, Boston, Massachusetts, 02114, USA. Phone: 603.749.6686; Email: zyu@broadinstitute.org. Or to: Reuben Kapur, Professor of Pediatrics, Herman B Wells Center for Pediatric Research, Indiana University School of Medicine, 1044 W. Walnut Street, R4-168, Indianapolis, Indiana, 46202, USA. Phone: 317.274.4658; Email: rkapur@iu.edu. Or to: Laura S. Haneline, Professor of Pediatrics, Microbiology and Immunology, Herman B Wells Center for Pediatric Research, Indiana University School of Medicine, 699 Riley Hospital Drive, RR 208, Indianapolis, Indiana, 46202, USA. Phone: 317.274.4716; Email: lhanelin@iu.edu.
Authorship note: R Kapur, LL, and R Kanumuri are co–first authors. ZY and SKP are co–senior authors.
Find articles by
Kumar, R.
in:
PubMed
|
Google Scholar
|
1Herman B Wells Center for Pediatric Research, Department of Pediatrics, Indiana University School of Medicine (IUSM), Indianapolis, Indiana, USA.
2Clinical and Translational Epidemiology Unit, Massachusetts General Hospital, Boston, Massachusetts, USA.
3Program in Medical and Population Genetics and the Cardiovascular Disease Initiative, Broad Institute of Harvard and MIT, Cambridge, Massachusetts, USA.
4Chemical Biology Program, Memorial Sloan Kettering Cancer Center, New York, New York, USA.
5Cardiovascular Research Center, Massachusetts General Hospital, Boston, Massachusetts, USA.
6Department of Medicine, Harvard Medical School, Boston, Massachusetts, USA.
Address correspondence to: Santhosh Kumar Pasupuleti, Assistant Research Professor of Pediatrics, Herman B Wells Center for Pediatric Research, Indiana University School of Medicine, 1044 W. Walnut Street, R4-169, Indianapolis, Indiana, 46202, USA. Phone: 317.274.0303; Email: skpasupu@iu.edu. Or to: Zhi Yu, Assistant Professor, Clinical and Translational Epidemiology Unit, Massachusetts General Hospital, 100 Cambridge Street, Office 1576, Boston, Massachusetts, 02114, USA. Phone: 603.749.6686; Email: zyu@broadinstitute.org. Or to: Reuben Kapur, Professor of Pediatrics, Herman B Wells Center for Pediatric Research, Indiana University School of Medicine, 1044 W. Walnut Street, R4-168, Indianapolis, Indiana, 46202, USA. Phone: 317.274.4658; Email: rkapur@iu.edu. Or to: Laura S. Haneline, Professor of Pediatrics, Microbiology and Immunology, Herman B Wells Center for Pediatric Research, Indiana University School of Medicine, 699 Riley Hospital Drive, RR 208, Indianapolis, Indiana, 46202, USA. Phone: 317.274.4716; Email: lhanelin@iu.edu.
Authorship note: R Kapur, LL, and R Kanumuri are co–first authors. ZY and SKP are co–senior authors.
Find articles by Koyama, S. in: PubMed | Google Scholar
1Herman B Wells Center for Pediatric Research, Department of Pediatrics, Indiana University School of Medicine (IUSM), Indianapolis, Indiana, USA.
2Clinical and Translational Epidemiology Unit, Massachusetts General Hospital, Boston, Massachusetts, USA.
3Program in Medical and Population Genetics and the Cardiovascular Disease Initiative, Broad Institute of Harvard and MIT, Cambridge, Massachusetts, USA.
4Chemical Biology Program, Memorial Sloan Kettering Cancer Center, New York, New York, USA.
5Cardiovascular Research Center, Massachusetts General Hospital, Boston, Massachusetts, USA.
6Department of Medicine, Harvard Medical School, Boston, Massachusetts, USA.
Address correspondence to: Santhosh Kumar Pasupuleti, Assistant Research Professor of Pediatrics, Herman B Wells Center for Pediatric Research, Indiana University School of Medicine, 1044 W. Walnut Street, R4-169, Indianapolis, Indiana, 46202, USA. Phone: 317.274.0303; Email: skpasupu@iu.edu. Or to: Zhi Yu, Assistant Professor, Clinical and Translational Epidemiology Unit, Massachusetts General Hospital, 100 Cambridge Street, Office 1576, Boston, Massachusetts, 02114, USA. Phone: 603.749.6686; Email: zyu@broadinstitute.org. Or to: Reuben Kapur, Professor of Pediatrics, Herman B Wells Center for Pediatric Research, Indiana University School of Medicine, 1044 W. Walnut Street, R4-168, Indianapolis, Indiana, 46202, USA. Phone: 317.274.4658; Email: rkapur@iu.edu. Or to: Laura S. Haneline, Professor of Pediatrics, Microbiology and Immunology, Herman B Wells Center for Pediatric Research, Indiana University School of Medicine, 699 Riley Hospital Drive, RR 208, Indianapolis, Indiana, 46202, USA. Phone: 317.274.4716; Email: lhanelin@iu.edu.
Authorship note: R Kapur, LL, and R Kanumuri are co–first authors. ZY and SKP are co–senior authors.
Find articles by
Natarajan, P.
in:
PubMed
|
Google Scholar
|
1Herman B Wells Center for Pediatric Research, Department of Pediatrics, Indiana University School of Medicine (IUSM), Indianapolis, Indiana, USA.
2Clinical and Translational Epidemiology Unit, Massachusetts General Hospital, Boston, Massachusetts, USA.
3Program in Medical and Population Genetics and the Cardiovascular Disease Initiative, Broad Institute of Harvard and MIT, Cambridge, Massachusetts, USA.
4Chemical Biology Program, Memorial Sloan Kettering Cancer Center, New York, New York, USA.
5Cardiovascular Research Center, Massachusetts General Hospital, Boston, Massachusetts, USA.
6Department of Medicine, Harvard Medical School, Boston, Massachusetts, USA.
Address correspondence to: Santhosh Kumar Pasupuleti, Assistant Research Professor of Pediatrics, Herman B Wells Center for Pediatric Research, Indiana University School of Medicine, 1044 W. Walnut Street, R4-169, Indianapolis, Indiana, 46202, USA. Phone: 317.274.0303; Email: skpasupu@iu.edu. Or to: Zhi Yu, Assistant Professor, Clinical and Translational Epidemiology Unit, Massachusetts General Hospital, 100 Cambridge Street, Office 1576, Boston, Massachusetts, 02114, USA. Phone: 603.749.6686; Email: zyu@broadinstitute.org. Or to: Reuben Kapur, Professor of Pediatrics, Herman B Wells Center for Pediatric Research, Indiana University School of Medicine, 1044 W. Walnut Street, R4-168, Indianapolis, Indiana, 46202, USA. Phone: 317.274.4658; Email: rkapur@iu.edu. Or to: Laura S. Haneline, Professor of Pediatrics, Microbiology and Immunology, Herman B Wells Center for Pediatric Research, Indiana University School of Medicine, 699 Riley Hospital Drive, RR 208, Indianapolis, Indiana, 46202, USA. Phone: 317.274.4716; Email: lhanelin@iu.edu.
Authorship note: R Kapur, LL, and R Kanumuri are co–first authors. ZY and SKP are co–senior authors.
Find articles by Haneline, L. in: PubMed | Google Scholar
1Herman B Wells Center for Pediatric Research, Department of Pediatrics, Indiana University School of Medicine (IUSM), Indianapolis, Indiana, USA.
2Clinical and Translational Epidemiology Unit, Massachusetts General Hospital, Boston, Massachusetts, USA.
3Program in Medical and Population Genetics and the Cardiovascular Disease Initiative, Broad Institute of Harvard and MIT, Cambridge, Massachusetts, USA.
4Chemical Biology Program, Memorial Sloan Kettering Cancer Center, New York, New York, USA.
5Cardiovascular Research Center, Massachusetts General Hospital, Boston, Massachusetts, USA.
6Department of Medicine, Harvard Medical School, Boston, Massachusetts, USA.
Address correspondence to: Santhosh Kumar Pasupuleti, Assistant Research Professor of Pediatrics, Herman B Wells Center for Pediatric Research, Indiana University School of Medicine, 1044 W. Walnut Street, R4-169, Indianapolis, Indiana, 46202, USA. Phone: 317.274.0303; Email: skpasupu@iu.edu. Or to: Zhi Yu, Assistant Professor, Clinical and Translational Epidemiology Unit, Massachusetts General Hospital, 100 Cambridge Street, Office 1576, Boston, Massachusetts, 02114, USA. Phone: 603.749.6686; Email: zyu@broadinstitute.org. Or to: Reuben Kapur, Professor of Pediatrics, Herman B Wells Center for Pediatric Research, Indiana University School of Medicine, 1044 W. Walnut Street, R4-168, Indianapolis, Indiana, 46202, USA. Phone: 317.274.4658; Email: rkapur@iu.edu. Or to: Laura S. Haneline, Professor of Pediatrics, Microbiology and Immunology, Herman B Wells Center for Pediatric Research, Indiana University School of Medicine, 699 Riley Hospital Drive, RR 208, Indianapolis, Indiana, 46202, USA. Phone: 317.274.4716; Email: lhanelin@iu.edu.
Authorship note: R Kapur, LL, and R Kanumuri are co–first authors. ZY and SKP are co–senior authors.
Find articles by
Yu, Z.
in:
PubMed
|
Google Scholar
|
1Herman B Wells Center for Pediatric Research, Department of Pediatrics, Indiana University School of Medicine (IUSM), Indianapolis, Indiana, USA.
2Clinical and Translational Epidemiology Unit, Massachusetts General Hospital, Boston, Massachusetts, USA.
3Program in Medical and Population Genetics and the Cardiovascular Disease Initiative, Broad Institute of Harvard and MIT, Cambridge, Massachusetts, USA.
4Chemical Biology Program, Memorial Sloan Kettering Cancer Center, New York, New York, USA.
5Cardiovascular Research Center, Massachusetts General Hospital, Boston, Massachusetts, USA.
6Department of Medicine, Harvard Medical School, Boston, Massachusetts, USA.
Address correspondence to: Santhosh Kumar Pasupuleti, Assistant Research Professor of Pediatrics, Herman B Wells Center for Pediatric Research, Indiana University School of Medicine, 1044 W. Walnut Street, R4-169, Indianapolis, Indiana, 46202, USA. Phone: 317.274.0303; Email: skpasupu@iu.edu. Or to: Zhi Yu, Assistant Professor, Clinical and Translational Epidemiology Unit, Massachusetts General Hospital, 100 Cambridge Street, Office 1576, Boston, Massachusetts, 02114, USA. Phone: 603.749.6686; Email: zyu@broadinstitute.org. Or to: Reuben Kapur, Professor of Pediatrics, Herman B Wells Center for Pediatric Research, Indiana University School of Medicine, 1044 W. Walnut Street, R4-168, Indianapolis, Indiana, 46202, USA. Phone: 317.274.4658; Email: rkapur@iu.edu. Or to: Laura S. Haneline, Professor of Pediatrics, Microbiology and Immunology, Herman B Wells Center for Pediatric Research, Indiana University School of Medicine, 699 Riley Hospital Drive, RR 208, Indianapolis, Indiana, 46202, USA. Phone: 317.274.4716; Email: lhanelin@iu.edu.
Authorship note: R Kapur, LL, and R Kanumuri are co–first authors. ZY and SKP are co–senior authors.
Find articles by
Pasupuleti, S.
in:
PubMed
|
Google Scholar
|
Published June 23, 2026 - More info
J Clin Invest. 2026;136(15):e202856. https://doi.org/10.1172/JCI202856.
© 2026 Kapur et al. This work is licensed under the Creative Commons Attribution 4.0 International License. To view a copy of this license, visit http://creativecommons.org/licenses/by/4.0/.
Received: November 25, 2025; Accepted: June 16, 2026


-
Results
Associations of obesity with type 2 diabetes and myeloid leukemia incidence. Obesity and metabolic dysfunction are increasingly recognized as critical modulators of hematopoietic malignancies, influencing both disease initiation and progression. However, the mechanisms by which obesity contributes to leukemia, particularly in the context of oncogenic mutations, remain poorly understood. Gain-of-function mutations in PTPN11 (encoding SHP2) are implicated in pediatric leukemias such as JMML and AML, yet it is unclear whether metabolic traits like obesity or central adiposity modulate disease risk or progression in individuals harboring these mutations.
To address this, we leveraged large-scale human population data from the UK Biobank, comprising 440,982 unrelated participants with exome sequencing and anthropometric measurements for BMI or WHR (Table 1). The mean (SD) age of the participants was 56.6 (8.1) years, 45.9% were male, 54.1% were female, and 45.0% reported being ever-smokers. The mean BMI was 27.4 (4.8) kg/m2, and the mean WHR was 0.87 (0.1). There were 13,717 (3.1%) participants with baseline Metformin use, and among the 26,701 participants with prevalent diabetes (types 1 and 2) there were 13,282 (50%) participants using Metformin (Table 1). Using these data, we examined the association of BMI and WHR with incident type 2 diabetes (T2D) and myeloid malignancies. Over a median follow-up of 13.5 years (IQR: 12.63–14.29), the incidence of T2D was 6.6%. For myeloid malignancies, the incidence was 0.21% over a median follow-up of 13.6 years (IQR: 12.89–14.35). Both BMI (P < 0.001) and WHR (P < 0.001) were significantly associated with incident T2D after adjustment for age at enrollment, sex, ever-smoker status, and the first 10 principal components of genetic ancestry (Table 2). Each 1-SD increase in BMI was associated with a 1.95-fold increased risk of T2D (HR: 1.95, 95% CI: 1.93–1.96). Similarly, a 1-SD increase in WHR corresponded to a 1.46-fold increase in T2D (HR: 1.46, 95% CI: 1.46–1.47). We next examined the association of BMI and WHR with the incidence of myeloid malignancies (Table 3). A 1-SD increase in both BMI (HR: 1.09, 95% CI: 1.02–1.17; P = 0.02) and WHR (HR: 1.12, 95% CI: 1.03–1.23; P = 0.01) was significantly associated with an elevated risk of myeloid malignancies. Furthermore, individuals with obesity who also had T2D demonstrated a stronger risk (HR: 1.51, 95% CI: 1.08–2.13; P = 0.02) of myeloid malignancies (Table 3) compared with lean participants without diabetes. To account for the potential protective effect of Metformin on myeloid leukemia, we then conducted sensitivity analyses, adjusting for baseline Metformin use. After the adjustment, the positive association between a 1-SD increase in BMI (HR: 1.08, 95% CI: 1.00–1.16; P = 0.04) and WHR (HR: 1.11, 95% CI: 1.01–1.21; P = 0.03) with the incidence of myeloid leukemia remained robust (Table 3).
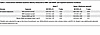 Table 3
Associations between baseline obesity measured as BMI1 and WHR2 and myeloid leukemia incidence
PTPN11 mutations are associated with adiposity and obesity-related cancer risk. Given the emerging connection between metabolic dysfunction and leukemogenesis and prior evidence linking PTPN11 mutations to pediatric leukemias and poor outcomes in adult cancers, we hypothesized that PTPN11 variants may contribute to adiposity and that obesity could amplify their oncogenic potential. To test this, we leveraged gene-based association results from 394,841 UK Biobank exomes in the Genebass database (15) using SAIGE-GENE (16). Rare missense variant burden in PTPN11 was negatively associated with fat-free mass across all measured body compartments including both arms, both legs, trunk, and whole body (β ranges from –0.003 to –0.0025 SD, P < 5 × 10⁻⁶; Table 4). These associations between fat-free mass and rare missense variant burden of more common mutations in adults such as TP53, FLT3, and NPM1 were not observed (Table 4). Consistent with a shift in body composition, our gene-based burden analysis also revealed an exome-wide significant association (P = 3.54 × 10⁻⁷) between PTPN11 and body weight (Figure 1A). Burden analyses stratified by variant type further revealed that this signal was primarily driven by a missense variant set (P = 3.29 × 10⁻⁷), which includes variants such as p.Glu76Asp, p.Glu76Lys, p.Val432Met, p.Pro565Leu, p.Met508Val, and p.Asn308Asp (Supplemental Table 1 and Supplemental Data File 1), and it also showed a strong association with BMI (P = 1.93 × 10⁻³) (Supplemental Table 1; supplemental material available online with this article; https://doi.org/10.1172/JCI202856DS1). These findings highlight the functional importance of missense variants in modulating metabolic traits and implicate PTPN11 mutations in the pathogenesis of obesity. To assess pathogenicity, mutant PTPN11 protein sequences were evaluated using sorting intolerant from tolerant (SIFT) and PolyPhen-2. Among these, the p.Glu76Asp and p.Glu76Lys variants scored as deleterious (tolerance index <0.01), whereas all tested variants were predicted to be pathogenic by PolyPhen-2 (Supplemental Table 2). Notably, we focused on the recurrent p.Glu76Lys (E76K) mutation, as it is among the most frequent and well-characterized PTPN11 driver mutations in leukemia. Structural analysis further revealed that the WT SHP2 protein adopts a closed, autoinhibited conformation stabilized by a hydrogen bond between E76 in the N-SH2 domain and R265 in the catalytic domain (Figure 1B). In contrast, the E76K-mutant SHP2 structure displayed an open conformation with complete loss of the E76-R265 interaction, consistent with the experimentally solved crystal structure (Protein Data Bank [PDB]: 6CMS) (Figure 1C). Instead, the substituted Lys76 established new hydrogen bonds with T73, Q79, and Y80 within the N-SH2 domain, thereby destabilizing the closed interface. These structural rearrangements provide a mechanistic basis for how the E76K mutation disrupts autoinhibition and favors constitutive activation of SHP2. Collectively, these findings implicate PTPN11 mutations in the genetic architecture of obesity and suggest that metabolic dysfunction may cooperate with oncogenic signaling in disease pathogenesis.
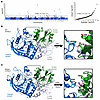 Figure 1
Association of PTPN11 mutations with obesity-related traits and cancer prevalence. (A) Manhattan plot (left) and QQ plot (right) depicting gene-based association results for PTPN11 rare variants with weight-related traits in the UK Biobank exome sequencing dataset. The Manhattan plot shows the –log10(P) values across chromosomes, highlighting PTPN11 with a significant association PTPN11 (P = 3.54 × 10⁻⁷). The QQ plot demonstrates deviation from the expected null distribution, confirming the significance association of PTPN11 mutation with overweight. (B and C) Structural consequences of the SHP2 E76K mutation. Ribbon diagrams of WT (B) and E76K-mutant (C) SHP2 structures showing the N-SH2 (green), C-SH2 (violet), and catalytic PTP (blue) domains. In the WT, E76 forms a stabilizing hydrogen bond with R265, maintaining the protein in a closed, autoinhibited conformation. In the mutant, substitution of E76 with lysine abolishes the E76-R265 interaction and introduces new hydrogen bonds with T73, Q79, and Y80, favoring an open conformation of SHP2. This conformational shift exposes the catalytic domain, providing a structural basis for constitutive activation and highlighting the catalytic pocket as a potential therapeutic target.
Apart from hematologic malignancies, PTPN11 mutations are also prevalent in nonhematologic solid cancers and often portend a poor prognosis (17). To determine whether obesity may further modify this risk, we analyzed PTPN11 mutations across solid cancer types in The Cancer Genome Atlas (TCGA) PanCancer cohort (n = 10,956). As summarized in Supplemental Figure 1A, the majority of cases involving PTPN11 mutations occurred in uterine corpus endometrial carcinoma (UCEC), followed by colorectal adenocarcinoma (COAD), skin cutaneous melanoma (SKCM), and a spectrum of other malignancies at lower frequencies. This indicates that PTPN11 mutations are broadly represented across diverse tumor types, with enrichment in specific cancer subtypes. Importantly, we found that PTPN11 mutations were disproportionately represented among patients with a high BMI (>30 kg/m2). As shown in Supplemental Figure 1B, a greater number of patients harboring PTPN11 variants had a markedly higher BMI than did PTPN11 variant carriers who had a low BMI. Correspondingly, more than half (56.86%) of all individuals with PTPN11 mutations were in the high-BMI subgroup (Supplemental Figure 1C). These findings suggest that PTPN11 mutations associate with adiposity and may synergize with obesity to modulate cancer risk. Collectively, these data support a model in which rare PTPN11 variants influence metabolic traits and show that co-occurrence with a high BMI may potentiate oncogenic signaling in diverse cancers, providing a potential mechanistic link between obesity, PTPN11 mutation, and tumor susceptibility.
Obesity induces the expansion and transformation of Ptpn11E76K/+-mutant HSC/Ps and exacerbates the development of an AML-like phenotype. To investigate the mechanistic link between PTPN11 mutations, obesity, and hematopoietic malignancy, we turned to mouse models with the Shp2E76K/+ mutation, allowing us to examine how mutant HSC/Ps behave in lean versus obese BM environments. Using a competitive BM transplantation (BMT) assay that allows measurement of the expansion, survival, and engraftment of Shp2E76K/+-mutant cells, we transplanted a mixture of BM cells from WT mice or donor mice carrying the Shp2E76K/+ mutation (CD45.2+) and BM cells from Boy/J competitor mice (CD45.1+) into lethally irradiated leptin-deficient LepOb/Ob (Ob/Ob) FBM mice or WT lean BM recipients (Figure 2A). Engraftment of Shp2E76K/+-mutant CD45.2+ cells and the frequencies of mature hematopoietic cells in the peripheral blood (PB) of recipient mice was monitored for 24 weeks following transplantation. Ob/Ob FBM mice transplanted with Shp2E76K/+-mutant BM cells showed increased engraftment of CD45.2+ cells and decreased engraftment of WT normal CD45.1+ cells in the PB compared with controls (Figure 2B). Measurement of PB counts exhibited that Ob/Ob FBM mice transplanted with Shp2E76K/+-mutant HSC/Ps had high absolute counts of WBCs and myeloid cells, including neutrophils and monocytes and decreased numbers of lymphocytes compared with other groups (Figure 2C). Similarly, increased frequencies of myeloid cells (Gr1+CD11b+) were observed in PB, BM, and spleens of Ob/Ob FBM mice transplanted with Shp2E76K/+-mutant HSC/Ps compared with control mice (Figure 2D and Supplemental Figure 2A). Additionally, Ob/Ob recipients of Shp2E76K/+-mutant HSC/Ps developed hepatosplenomegaly (Supplemental Figure 2, B and C). As expected, systemic metabolic abnormalities including increased body weight, hyperglycemia, and visceral adiposity were evident in all Ob/Ob mice regardless of whether they received WT or Shp2E76K/+-mutant HSC/Ps (Supplemental Figure 2, D–F), reflecting the underlying leptin deficiency. Importantly, while obesity established a permissive metabolic environment, leukemic progression characterized by splenomegaly, expansion of immature myeloid cells, and skewed hematopoietic differentiation was specifically driven by Shp2E76K/+-mutant HSC/Ps. Consistent with this, obese recipient mice transplanted with Shp2E76K/+-mutant cells showed significantly (median overall survival: 190 vs. 240 days, P = 0.03) reduced survival compared with lean controls (Supplemental Figure 2G).
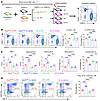 Figure 2
Shp2E76K/+-mutant cells outcompete the normal WT cells in Ob/Ob recipients. (A) Schematic of the competitive BMT assay. Donor BM cells from Shp2E76K/+ or WT mice (CD45.2+) were mixed with Boy/J competitor (CD45.1+) BM cells (500,000:500,000) and then transplanted into lethally irradiated WT or Ob/Ob recipient mice. Donor-derived chimerism was observed using antibodies against CD45.1 or CD45.2. (B) Representative profiles of flow cytometry for donor chimerism in the PB of recipient mice and quantification of CD45.1+ cells and CD45.2+ in the PB of indicated recipient mice. (C) PB counts at 24 weeks after BMT from the indicated recipient mice. (D) Representative flow cytometric profile of myeloid cells (Gr-1+CD11b+) in the PB of the indicated recipient mice and frequency of Gr-1+CD11b+ myeloid cells in the PB of competitive transplant recipients over 24 weeks. n = 4 mice per group. Freq., frequency. **P < 0.05, **P < 0.005, ***P < 0.0005, ****P < 0.0001, by 1-way ANOVA followed by Tukey’s post hoc test. Data are presented as the mean ± SEM.
Notably, higher frequencies of c-KIT+CD11b+ myeloid blasts (~14% of blasts) were observed in BM and spleens from Ob/Ob FBM mice transplanted with Shp2E76K/+-mutant HSC/Ps, consistent with the development of the early-onset AML-like phenotype compared with other groups (Figure 3A). Furthermore, the frequency of Lin–, Sca-1+, and c-KIT+ (LSK) cells, abnormal BM cellularity, frequency of hematopoietic progenitor cell 1cells (LSK CD48+CD150–) and granulocyte macrophage progenitors (GMPs) (c-KIT+CD16+CD32+CD34+ cells) were elevated in Ob/Ob FBM mice transplanted with Shp2E76K/+-mutant HSC/Ps compared with control groups (Figure 3, B–E). Notably, Ob/Ob FBM mice transplanted with Shp2E76K/+-mutant HSC/Ps also had a substantially higher abundance of inflammatory (F4/80+CD206+) TAMs compared with other groups (Supplemental Figure 3A). These findings suggest that in an obese FBM microenvironment, Shp2E76K/+ HSC/Ps represent disease-initiating cells, which results in abnormal differentiation of HSC/Ps, self-renewal, and hyperproliferation of immature myeloid cells.
 Figure 3
Shp2E76K/+-mutant myeloid blasts and HSC/Ps are expanded in Ob/Ob recipients. (A) Representative flow cytometric profiles of c-KIT+CD11b+ myeloid blasts from the indicated recipient mice and frequency of c-KIT+CD11b+ cells in BM and in spleens of competitive transplant recipients over 24 weeks. (B) Representative flow cytometric profile of LSK cells in BM from the indicated recipient mice and absolute number of LSK cells in BM and (C) BM cellularity of competitive transplant recipients over 24 weeks. (D) Representative flow cytometric profile of HPC1 cells (LSK CD48+CD150–) in BM from the indicated recipient mice and frequency of HPC1 cells in BM of competitive transplant recipients over 24 weeks. (E) Representative flow cytometric profile of HSC/Ps in BM and frequency of GMPs (Lin–c-KIT+CD16/32+CD34+) and MEPs (Lin–c-KIT+CD16/32–CD34–) in BM of competitive transplant recipients over 24 weeks. n = 4 mice per group. *P < 0.05, **P < 0.005, ***P < 0.0005, ****P < 0.0001, by 1-way ANOVA followed by Tukey’s post hoc test. Data are presented as the mean ± SEM.
In obese FBM, HSC/Ps are frequently surrounded by mature immune cells, which can contribute to enhanced myelopoiesis and expansion of myeloid progenitors (18). Thus, the inflammatory obese BM microenvironment is likely to affect the growth and self-renewal of these cells in part by secreting inflammatory chemokines, lymphokines, and cytokines (19). To investigate whether obese FBM enhanced the systemic inflammation due to the presence of Shp2E76K/+ mutation, serum cytokine levels were measured. Serum cytokine/chemokine analysis of Ob/Ob FBM mice transplanted with Shp2E76K/+ BM cells showed elevated levels of proinflammatory cytokines, including IL-5, IL-6, and IL-17A and chemokines including CXCL-5 and CCL3 compared with control mice (Supplemental Figure 3B). To evaluate inflammatory signaling in the BM of patients with AML, we compared the expression of key cytokines and chemokines between control and AML samples. AML BM samples (Gene Expression Omnibus [GEO]: GSE1159) (20) exhibited higher expression of IL-17A, IL-6, IL-5, TNF, IL-1β, CCL3, and CCL20 relative to controls (Supplemental Figure 4). Consistent with these findings, prior studies have reported increased levels of IL-6, IL-17A, IL-1β, TNF, CCL2, and CCL3 in the BM plasma of patients with AML compared with healthy individuals (21–24). Together, these findings suggest that Shp2E76K/+-mutant HSC/Ps under proinflammatory conditions rapidly progressed to an AML-like phenotype and end up outcompeting the WT BM cells in Ob/Ob recipient mice compared with WT mice.
Leptin is a hormone secreted from fat cells such as adipose tissue, and it helps to regulate food intake and body weight, and plays a key role in proinflammatory immune responses, angiogenesis, and lipolysis (25). Both humans and mice with leptin (Lep) or the leptin receptor (Lepr) develop obesity, hypertension, dyslipidemia, T2DM, insulin resistance, cardiovascular disease (CVD), and some types of cancers (26). To assess how Shp2E76K/+-mutant HSC/Ps respond in a Lepr-deficient (Db/Db) environment, we performed competitive BMT of a mixture of BM cells from Shp2E76K/+ donor mice (CD45.2+) and BM cells from Boy/J competitor mice (CD45.1+) into lethally irradiated Db/Db or WT recipient mice to determine whether Shp2E76K/+ cells behave in a manner similar to those in Ob/Ob recipient mice or in a different manner (Supplemental Figure 5A). All the Db/Db recipient mice transplanted with Shp2E76K/+-mutant BM cells became moribund at 22 weeks after transplantation. Donor-derived CD45.2+ cell percentages derived from Shp2E76K/+-mutant mice were elevated in Db/Db recipient mice compared with percentages in WT recipients, similar to Ob/Ob recipient mice (Supplemental Figure 5B). Furthermore, Gr-1+CD11b+ myeloid cells derived from Shp2E76K/+ (CD45.2+) donor cells were increased in the PB of Db/Db recipients compared with WT recipients (Supplemental Figure 5C). Hematologic analysis of PB counts showed that Db/Db mice transplanted with Shp2E76K/+ BM had increased absolute counts and percentages of neutrophils and monocytes and a modest reduction in platelets compared with WT recipient mice (Supplemental Figure 5D). Hepatosplenomegaly and increased body weights were also noted in Db/Db mice transplanted with Shp2E76K/+-mutant cells (Supplemental Figure 5, E–G), a phenotype seen in Ob/Ob recipients as well. Notably, donor-derived CD45.2+ cells and Gr-1+CD11b+ mature myeloid cells in BM and spleens were elevated in the Db/Db recipient mice transplanted with Shp2E76K/+-mutant cells compared with WT mice (Supplemental Figure 5, H and I). Additionally, the frequencies of c-KIT+CD11b+ myeloid blasts derived from Shp2E76K/+ (CD45.2+) donor cells were increased in the BM, spleen, and PB of Db/Db recipient mice compared with WT mice (Supplemental Figure 5J). We also noted that the frequency and the absolute number of LSK cells, BM cellularity, frequency, and absolute numbers of Lin-Sca-1+c-Kit+CD48+CD150– (HPC1) cells and GMPs were increased and a profound decrease in megakaryocyte erythroid progenitors (MEPs) (c-KIT+CD16/32–CD34– cells) was noted in Db/Db recipient mice transplanted with Shp2E76K/+-mutant cells compared with WT recipient mice (Supplemental Figure 6, A–D). Importantly, serum cytokine and chemokine analysis showed that, similar to Shp2E76K/+ BM cells transplanted into Ob/Ob recipient mice, Db/Db recipient mice transplanted with same cells also showed elevated proinflammatory cytokines and chemokines such as IL-17A, granulocyte-CSF (G-CSF), and IL-12p70 (Supplemental Figure 6E). These results suggest that obesity-induced inflammation promoted the growth of Shp2E76K/+-mutant HSC/Ps, which rapidly developed into AML-like cells and showed signs of leukemogenesis in Db/Db recipient mice compared with WT mice.
Obesity amplifies IL-17A–linked inflammatory, metabolic, and cellular reprogramming in Shp2E76K/+-driven BM. To dissect transcriptional alterations induced by obesity in the context of PTPN11-mutant hematopoiesis, we compared BM transcriptomes from WT and Ob/Ob mice transplanted with Shp2E76K/+-mutant HSC/Ps. Differential expression analysis identified 742 genes upregulated and 559 downregulated in Ob/Ob recipients compared with WT controls (FDR <0.05; Figure 4A). Strikingly, the most prominently upregulated genes included canonical inflammatory mediators such as Il17a, Il17ra, Il1B, Ccl2, Ccl20, Tnf, and Il6, pointing to a fatty marrow environment in which obesity and oncogenic Shp2 signaling converged to fuel a proinflammatory niche. Pathway enrichment analyses reinforced this conclusion. Kyoto Encyclopedia of Genes and Genomes (KEGG) analysis highlighted IL-17 signaling, Th17 cell differentiation, cytokine-cytokine receptor interactions, JAK/STAT signaling, and TNF signaling as the top activated pathways (Figure 4B). Likewise, Gene Ontology (GO) analysis revealed marked enrichment of genes linked to inflammatory responses, neutrophil migration, chemokine signaling, and GPCR-mediated signaling (Figure 4C). Gene set enrichment analysis (GSEA) independently validated robust enrichment of Th17, IL-17, and TNF signaling pathways in Ob/Ob recipients (Figure 4, D and E). In line with these transcriptional signatures, flow cytometric analysis revealed a marked expansion of Th17 cells (IL-17A+CD4+) in the Ob/Ob recipients compared with WT controls (Figure 4F). Additional hallmark pathways enriched in Ob/Ob recipients transplanted with Shp2E76K/+-mutant HSC/Ps included the inflammatory response, TGF-β signaling, and TNF signaling via NF-κB (Figure 5A). At the cellular level, obesity reinforced myeloid bias in the setting of Ptpn11-mutant hematopoiesis. As shown in Figure 2, B–D, and Figure 3, D and E, Ob/Ob recipients transplanted with Shp2E76K/+ HSC/Ps displayed elevated neutrophils, monocytes, and HSC/Ps, accompanied by a reduction in lymphocytes and platelets. Cell-type–specific enrichment of bulk BM RNA-seq analysis further confirmed the expansion of inflammatory myeloid cell populations, with strong activation signatures in CD34+ immature neutrophils, monocytes, and stromal cells, together with suppression of B cell subsets and platelets (Figure 5B). In addition to immune remodeling, obesity triggered profound metabolic rewiring of leukemic BM. Pathway analysis identified enrichment of lipid and atherosclerosis signaling, fatty acid metabolism, adipocytokine signaling, glycolysis/gluconeogenesis, and cholesterol metabolism (Figure 5, C–F). These findings suggest that obesity integrated inflammatory signaling with altered metabolic pathways to further potentiate Shp2E76K/+-driven leukemogenesis. Together, these data demonstrate that obesity synergized with Ptpn11-mutant hematopoiesis to amplify IL-17A–linked inflammation, skew hematopoiesis toward proleukemic myeloid lineages, suppress adaptive immune cell subsets, and reprogram BM metabolism, thereby reinforcing a microenvironment conducive to leukemic progression.
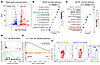 Figure 4
Obesity exacerbates transcriptomic dysregulation in Shp2E76K/+-mutant HSC/Ps. (A) Differential gene expression analysis comparing Ob/Ob mice bearing Shp2E76K/+ HSC/Ps with WT mice bearing Shp2E76K/+ HSC/Ps identified 559 significantly downregulated and 742 upregulated genes (Padj < 0.05, log2FC >1). (B) GSEA of KEGG pathways (Bonferroni-Hochberg–adjusted P < 0.05) and (C) GO biological processes (Bonferroni-Hochberg–corrected, Padj < 0.05) revealed key pathways altered in Ob/Ob mice bearing Shp2E76K/+ HSC/Ps relative to WT counterparts. (D and E) Ranked GSEA plots showing enrichment of Th17 cell differentiation (D) and IL-17 and TNF signaling (E) pathways in Ob/Ob mice bearing Shp2E76K/+ HSC/Ps compared with WT mice bearing Shp2E76K/+ HSC/Ps. (F) Flow cytometric analysis of Th17 cells and frequency of Th17 (CD4+IL-17A+) cells in spleens of Ob/Ob mice bearing Shp2E76K/+ HSC/Ps and WT mice bearing Shp2E76K/+ HSC/Ps. n = 4 mice per group. ****P < 0.0001, by 2-tailed Student’s t test. Data are presented as the mean ± SEM.
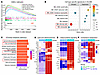 Figure 5
Transcriptomic pathway and gene expression changes in Ob/Ob mice bearing Shp2E76K/+-mutant HSC/Ps. (A) GSEA of RNA-seq data show significant activation of inflammatory and cancer hallmark pathways (NES >1, Padj < 0.05) in Ob/Ob mice bearing Shp2E76K/+ HSC/Ps. (B) Altered BM cell-type–specific gene signatures identified by GSEA (Bonferroni-Hochberg correction, Padj < 0.05) in Ob/Ob mice bearing Shp2E76K/+ HSC/Ps versus WT recipient mice. (C) Metabolic pathway enrichment analysis with heatmap visualization of gene expression changes involved in (D) lipid metabolism and atherosclerosis, (E) adipocytokine signaling, and (F) cholesterol metabolism in Ob/Ob mice bearing Shp2E76K/+ HSC/Ps. Expression data are represented as z scores normalized across groups.
Serum cytokine profiling of Shp2E76K/+-mutant HSC/Ps transplanted into Ob/Ob, and Db/Db recipient mice revealed markedly elevated the expression of IL-17A compared with WT recipients. To extend these findings to humans, we analyzed circulating IL-17A levels in plasma from 50,000 UK Biobank participants with available proteomics data who were free of hematological malignancies and myeloid leukemia at baseline. Among 2,498 participants (5.26%) with both diabetes and obesity defined by WHR, the mean plasma IL-17A levels were 0.14 SD higher (95% CI: 0.10–0.18, P < 0.001) compared with individuals without either condition or with only one (Table 5). Elevated IL-17A levels were also observed in participants with diabetes versus those without diabetes (0.12 SD higher, 95% CI: 0.08–0.16) and in individuals with obesity versus those without obesity (0.03 SD higher, 95% CI: 0.01–0.05). Similarly, participants with both obesity and diabetes had reduced average plasma GLP-1R levels compared with participants who were neither obese nor diabetic, nor both (ß ranges from –0.06 to –0.04, P < 0.05, Table 6).
IL-17A, a proinflammatory cytokine predominantly secreted by Th17 cells, signals through the IL-17RA–IL-17RC receptor complex and plays a dual role in host defense and pathology. While essential for protection against extracellular bacterial and fungal infections, dysregulated IL-17A promotes chronic inflammation, autoimmunity, and tumor progression (27–29). Notably, IL-17A has been shown to induce macrophage polarization toward an M2-like immunosuppressive phenotype (30). Consistently, elevated serum IL-17A in patients with various malignancies correlates with a poor prognosis (31). Clinically, 3 FDA-approved IL-17A–targeting antibodies — secukinumab, ixekizumab, and brodalumab — are used for autoimmune diseases, with secukinumab recently approved for pediatric patients aged 2 years or older for the treatment of juvenile psoriatic arthritis (32, 33).
Likewise, GLP-1R agonists have emerged as potent modulators of glucose homeostasis, body weight, and inflammation. Beinaglutide, a short-acting recombinant GLP-1R agonist that is structurally nearly identical to endogenous human GLP-1, provides rapid postprandial glucose control, robust weight loss, and antiinflammatory effects (34–37). Taken together, these observations led us to hypothesize that combined IL-17A inhibition and GLP-1R activation could synergistically suppress leukemic expansion, limit M2-like macrophage–mediated immunosuppression, and restore normal hematopoiesis in obese mice harboring Shp2E76K/+-mutant HSC/Ps.
The combination of GLP-1R agonist and anti–IL-17A antibody therapy inhibits exacerbation of Shp2E76K/+-mutant HSC/Ps in Ob/Ob mice. To determine whether simultaneous targeting of metabolic and inflammatory pathways could mitigate obesity-driven exacerbation of Shp2E76K/+-mutant hematopoiesis, we performed competitive BMT again, as shown in Figure 2A, using a 1:1 mixture of Shp2E76K/+ donor BM cells (CD45.2+) and competitor Boy/J BM cells (CD45.1+). These cells were transplanted into lethally irradiated Ob/Ob or WT recipients (Figure 2A). By week 8 after transplantation, the Ob/Ob recipients showed markedly enhanced engraftment of Shp2E76K/+ donor HSC/Ps compared with WT controls. The mice were then randomized and treated for 30 days with beinaglutide, a GLP-1R agonist (3 mg/kg, s.c.), an anti–IL-17A antibody (200 μg/mouse, i.p., 3 times weekly), or the combination of both. Dosing regimens were selected on the basis of prior studies demonstrating efficacy with minimal toxicity (38, 39). Combination therapy markedly increased the proportion of normal CD45.1+ competitor cells and concomitantly reduced Shp2E76K/+-mutant CD45.2+ cells in both the PB and BM of Ob/Ob recipients (Figure 6, A and B). Furthermore, Th17 cell (IL-17A+CD4+) frequencies, body weight, fasting blood glucose levels, and visceral adipose tissue mass was reduced in the combination therapy group compared with the other groups (Figure 6, C–F). Single-agent treatments yielded partial reductions in mutant myeloid (Gr-1+CD11b+) populations, whereas combination therapy showed substantial suppression in both PB and BM (Figure 6G). Notably, combination therapy ameliorated hepatosplenomegaly, a hallmark of AML and JMML, in Ob/Ob recipients (Figure 7, A and B) and reduced leukemic stem/progenitor compartments in the BM, including LSK cells, HPC1 cells, and GMPs, while increasing MEP frequency (Figure 7, C–E). Together, these results demonstrate that dual targeting of IL-17A–driven inflammation and metabolic dysregulation not only limited the expansion of Shp2E76K/+-mutant HSC/Ps in obese hosts but also promoted the restoration of normal hematopoiesis, indicating the therapeutic potential of this combinatorial approach for obesity-associated leukemia pathogenesis.
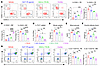 Figure 6
Combination therapy with GLP-1R agonist and an anti–IL-17A antibody reduces myeloid cell infiltration and improves metabolic parameters in Ob/Ob mice bearing Shp2E76K/+-mutant HSC/Ps. (A) Representative flow cytometry plots of donor chimerism (CD45.1+CD45.2+) in the PB of recipient mice after 30 days of the indicated drug treatment. Graphs in A show quantification of CD45.1+ cells and CD45.2+ cells in PB and (B) quantification of CD45.1+ cells and CD45.2+ cells in BM after 30 days of the indicated drug treatment. (C) Quantification of IL-17A+CD4+ cells in spleens after 30 days of the indicated drug treatment. Mouse (D) body weights, (E) fasting blood glucose levels, and (F) visceral adipose white tissue weights after 30 days of the indicated drug treatments. (G) Representative flow cytometric profile of myeloid cells (Gr-1+CD11b+) in the PB of recipient mice after 30 days of the indicated drug treatment and quantification of Gr-1+CD11b+ double-positive cells in PB and BM after 30 days of the indicated drug treatment. n = 3–4 mice per group. *P < 0.05, **P < 0.005, ***P < 0.0005, and ****P < 0.0001, by 1-way ANOVA followed by Tukey’s post hoc test. Data are presented as the mean ± SEM.
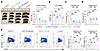 Figure 7
Combination treatment with a GLP-1R agonist and anti–IL-17A antibody attenuates splenomegaly and normalizes aberrant HSC/P populations in Ob/Ob mice bearing Shp2E76K/+-mutant HSC/Ps. (A) Spleen images and quantification of spleen weights, (B) liver weights, (C) LSK cells, and (D) HPC-1 cells. (E) Representative flow cytometry plots of HSC/Ps in BM of recipient mice after 30 days of the indicated drug treatment and quantification of GMPs and MEPs in BM after 30 days of the indicated drug treatment. n = 3–4 mice per group. *P < 0.05, **P < 0.005, and ***P < 0.0005, by 1-way ANOVA followed by Tukey’s post hoc test. Data are presented as the mean ± SEM.
Combined GLP-1R agonism and IL-17A blockade most effectively reverses inflammatory and myeloid reprogramming in obese mice bearing Shp2E76K/+ cells. To define the molecular effect of the GLP-1R agonist, the anti–IL-17A antibody, and their combination in obesity-driven, Ptpn11-mutant hematopoiesis, we compared BM transcriptomes from Ob/Ob mice bearing Shp2E76K/+ HSC/Ps treated with vehicle, a GLP-1R agonist, an anti–IL-17A antibody, or both agents (Combo treatment). Whimle both monotherapies partially attenuated inflammatory gene expression, Combo treatment produced the most extensive transcriptional reprogramming, with 882 genes downregulated and 328 upregulated relative to the vehicle-treated HSC/Ps (log2 fold change [FC]>|1|, FDR < 0.05; Figure 8A). Pathway enrichment analysis demonstrated that Combo therapy most strongly suppressed immune and inflammatory signaling cascades. KEGG pathways were downregulated in the Combo group, including Th17 cell differentiation, IL-17 and TNF signaling, JAK/STAT signaling, NF-κB signaling, cytokine-cytokine receptor interaction, and lipid/atherosclerosis signaling (Figure 8B). GO enrichment analysis corroborated inhibition of the inflammatory response, cytokine-mediated signaling, granulocyte/neutrophil migration, and myeloid leukocyte chemotaxis (Figure 8C). Ranked GSEA confirmed a marked downregulation of Th17 cell differentiation (Figure 8D) and attenuation of IL-17/TNF signaling pathways (normalized enrichment score [NES] >1, adjusted P [Padj] < 0.05; Figure 8E), with network analysis revealing coordinated suppression of Il17a, Il17re, Tnf, Cxcl1, Ccl2, Mmp13, and Socs3. Heatmap profiling across all treatment arms showed that GLP-1R agonist or anti–IL-17A monotherapy each reduced subsets of inflammatory cytokine/chemokine genes (Il1b, Ccl3, Ccl4, Cxcl2, Cxcl5, Tnf) and cellular response genes, whereas Combo therapy broadly normalized the expression toward WT-like levels (Figure 9, A and B). GSEA of hallmark pathways mirrored this pattern, with the strongest suppression of inflammatory response, IFN-α/IFN-γ signaling, TGF-β signaling, and TNF signaling via NF-κB in the Combo group (Figure 9C). Cell-type–specific enrichment revealed that Combo therapy markedly decreased CD34+ immature neutrophils and monocytes, suppressed stromal cell activation, and partially restored the B cell compartment (Figure 9D). A reduction in BM monocytes/macrophage cell abundance was observed through deconvolution analysis in the Combo group compared with the vehicle-treated group (Figure 9E), which is consistent with our flow cytometric analysis (Figure 6G). In addition to immune reprogramming, Combo therapy profoundly corrected metabolic dysregulation in the BM. Vehicle-treated Ob/Ob mice transplanted with Shp2E76K/+ HSC/Ps showed increased expression of genes in pathways related to lipid metabolism, fatty acid metabolism, adipocytokine signaling, atherosclerosis, and cholesterol metabolism (Figure 5, C–F). Combo therapy restored the expression of these metabolic genes toward baseline levels, normalizing fatty acid and cholesterol handling, suppressing adipocytokine-mediated proinflammatory signaling, and reversing the transcriptional programs associated with vascular and systemic metabolic dysfunction–related gene expression compared with other groups (Supplemental Figure 7, A and B). Collectively, these findings demonstrate that, while GLP-1R agonism or IL-17A blockade alone could partially counter obesity-driven IL-17/TNF–dominated inflammatory programs in Shp2E76K/+ hematopoiesis, their combination most effectively dismantled these networks, normalized immune cell composition, and suppressed proatherogenic metabolic signatures, highlighting a potentially synergistic therapeutic avenue for obesity-associated leukemia progression.
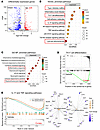 Figure 8
Combination therapy with a GLP-1R agonist and an anti–IL-17A antibody reverses inflammatory and myeloid dysregulation in Ob/Ob mice bearing Shp2E76K/+ HSC/Ps. (A) Differential gene expression analysis comparing Ob/Ob mice bearing Shp2E76K/+ HSC/Ps treated with the Combo therapy (GLP-1R agonist plus anti–IL-17A antibody) versus mice treated with vehicle revealed 882 significantly downregulated and 328 upregulated genes (Padj < 0.05). (B and C) GSEA of (B) KEGG pathways and (C) GO biological processes identified significantly enriched pathways in the Combo-treated group compared with the vehicle-treated group (Bonferroni-Hochberg Padj < 0.05). (D and E) Ranked GSEA plots show suppression of inflammatory pathways, including Th17 cell differentiation (D), IL-17 signaling, and TNF signaling (E) in Combo-treated mice relative to vehicle controls (NES >1, Padj < 0.05). Category-network plot on the right in E shows network visualization of differentially expressed genes (DEGs) associated with the IL-17 and TNF signaling pathways. Node size corresponds to gene connectivity, and node color represents relative expression changes.
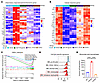 Figure 9
Combined GLP-1R agonism and IL-17A blockade restores BM immune homeostasis in Ob/Ob mice harboring Shp2E76K/+ HSC/Ps. (A and B) Heatmap of normalized z scores depicting the expression levels of key inflammatory response genes, cytokines, and chemokines (A) and related cellular response profiles (B) across treatment groups. (C) GSEA of inflammatory and cancer hallmark pathways and (D) enrichment of BM cell-type–specific gene signatures highlight the molecular effect of combination therapy compared with vehicle-treated Ob/Ob mice bearing Shp2E76K/+ HSC/Ps. (E) Quantification of relative monocyte and macrophage abundance in BM across treatment groups shows significant reductions in the combination group compared with vehicle. ****P < 0.0001, by 1-way ANOVA followed by Tukey’s post hoc test. Data are presented as the mean ± SEM.
Combination therapy with GLP-1R agonist and IL-17A blockade reverses obesity and Shp2E76K/+-driven macrophage expansion, diminishes M2-like macrophages and T cell exhaustion, and restores cytotoxic T cell immunity. Given the pronounced systemic and hematopoietic inflammatory signatures observed in Ob/Ob recipients of Shp2E76K/+-mutant HSC/Ps (Figures 6 and 7), we next examined adipose tissue macrophages (ATMs), a major driver of chronic inflammation in obesity-associated myeloproliferation. Consistent with enhanced visceral adiposity (Supplemental Figure 2F), these mice exhibited a marked expansion of F4/80+CD206+ ATMs (Supplemental Figure 3A). To define the molecular basis of this expansion, we performed RNA-seq on sorted F4/80+ ATMs. Transcriptomic profiling showed 2,031 downregulated and 1,383 upregulated genes in F4/80+ ATMs in Ob/Ob mice transplanted with Shp2E76K/+-mutant HSC/Ps compared with WT controls (Figure 10A). GSEA analysis identified enrichment of inflammatory and stress-related programs, including IFN-α/-γ responses, IL-6/JAK/STAT3 signaling, ROS production, the unfolded protein response, and TGF-β signaling in F4/80+ ATMs in Ob/Ob mice harboring Shp2E76K/+-mutant cells relative to WT controls (Figure 10B). Pathway analysis further revealed activation of the IL-17 and programmed cell death protein 1/programmed death–ligand 1 (PD-1/PD-L1) signaling cascades, with increased expression of Pdl1, Myd88, Raf1, Rela, and Traf6 (Figure 10, C and D). GO analysis confirmed the upregulation of genes involving macrophage activation and functional programs, spanning signaling molecules (Akt3, Mapk13, Dusp1, Dusp5), surface receptor and chemokine molecules (Cxcr4, Ccr1, Tlr2, Cxc3cr1, Cxcr4, Fpr1, Nt5e, Cxcr2, S1pr4), and transcription factors (Id2, Tox2, Fosl1, Cebpb, Irf7) (Figure 10, E–G). Additionally, F4/80+ ATMs in Ob/Ob mice harboring Shp2E76K/+-mutant HSC/Ps led to increased expression of M2-like macrophage–associated genes, including Arg1, Cd274 (encoding PD-L1), Chil3, Il10, Socs1, and Nfil3 (Figure 10H). Collectively, these findings demonstrate that Shp2E76K/+ HSC/Ps profoundly remodeled the ATM compartment, driving polarization toward an inflammatory and immunosuppressive state.
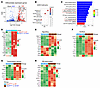 Figure 10
Shp2E76K/+ HSC/Ps transplantation drives inflammatory and metabolic dysregulation in ATMs of Ob/Ob mice. (A) Differential gene expression analysis of sorted F4/80+ ATMs from Ob/Ob mice transplanted with Shp2E76K/+ versus WT HSC/Ps, showing 2,031 downregulated (Down) and 1,383 upregulated (Up) genes (Padj < 0.05). (B) GSEA enrichment analysis (Bonferroni-Hochberg–corrected Padj < 0.05) highlighting inflammatory and metabolic dysfunction signatures in Ob/Ob mice transplanted with Shp2E76K/+ ATMs relative to WT. (C and D) Pathway analysis demonstrating enrichment of PD-1/PD-L1 checkpoint signaling and IL-17 pathways (C) with a corresponding heatmap of PD-1/PD-L1 pathway gene expression (D). (E–G) Heatmaps showing representative DEGs in ATMs, including signaling mediator, cell-surface, and transcription factor genes. (H) Heatmap displaying elevated expression of M2-associated macrophage markers in Ob/Ob mice transplanted with Shp2E76K/+ HSC/Ps compared with WT.
We next tested whether dual GLP-1R agonism and IL-17A blockade could reverse these changes. Compared with vehicle treatment, Combo therapy reprogrammed the ATM transcriptome, with 1,156 genes downregulated and 936 upregulated (Figure 11A) and a substantial reduction in F4/80+ ATM abundance (Figure 11B). GSEA analysis revealed suppression of proliferative and inflammatory programs, including G2M checkpoint, UV response, KRAS signaling, hypoxia, TGF-β, IL-6/JAK/STAT3, and inflammatory response signaling pathways (Figure 11, C and D). KEGG enrichment analysis further demonstrated marked inhibition of IL-17 and TNF signaling, which are 2 central mediators of obesity-driven myeloproliferation, together with reductions in DNA replication and homologous recombination activity (Figure 11, E and F). Importantly, metabolic pathway analysis showed that ATMs from Ob/Ob mice exhibited upregulation of de novo lipogenesis and glycolysis-associated genes alongside reduced expression of fatty acid oxidation genes, consistent with a metabolically activated, inflammatory state. Although either GLP-1R agonism or IL-17A blockade alone produced modest effects, the Combo therapy robustly normalized ATM metabolism, suppressing lipogenic and glycolytic programs, while restoring fatty acid oxidation gene activity (Figure 11, G and H, and Supplemental Figure 7C). These findings show that dual targeting of metabolic and inflammatory signaling is required to fully reprogram macrophage function and overcome obesity-driven myeloproliferation.
 Figure 11
Combination of GLP-1R agonist and anti–IL-17A antibody therapy reverses inflammatory and metabolic dysregulation in ATMs of Ob/Ob mice bearing Shp2E76K/+-mutant HSC/Ps. (A) Differential gene expression analysis of ATMs from Combo-treated versus vehicle-treated Ob/Ob mice, identifying 1,156 downregulated and 936 upregulated genes. (B) Flow cytometry plots and quantification of CD45+F4/80+ ATMs following vehicle or Combo therapy. (C and D) GSEA hallmark pathway enrichment showing reversal of inflammatory response and metabolic signatures in ATMs upon Combo therapy. (E and F) KEGG pathway analysis demonstrates suppression of IL-17, TNF, and DNA repair pathways, along with other metabolic and immune-related programs, in ATMs from Combo-treated mice. (G and H) Expression of de novo lipogenesis genes (Fas, Nr1h2, Nr1h3, and Insig1) and fatty acid oxidation genes (Acaa2, Cpt1a, Etfb, and Etfa) in ATMs from WT and Ob/Ob mice bearing Shp2E76K/+ HSC/Ps and treated with the indicated drugs. n = 3–4 mice per group. *P < 0.05, **P < 0.005, ***P < 0.0005, and ****P < 0.0001, by 1-way ANOVA followed by Tukey’s post hoc test. Data are presented as the mean ± SEM.
In line with the accumulation of M2-like TAMs observed in Ob/Ob recipients of Shp2E76K/+-mutant HSC/Ps (Figure 10H), Combo therapy with an anti–IL-17A antibody and a GLP-1R agonist markedly reduced CD206+ and Arg1+ M2-like TAMs compared with either monotherapy- or vehicle-treated mice (Figure 12A). Supporting this observation, RNA-seq analysis revealed consistent downregulation of M2-like TAMs associated and macrophage-regulatory gene expression following Combo treatment (Figure 12B). In Ob/Ob mice bearing Shp2E76K/+-mutant HSC/Ps, immune dysregulation was further characterized by elevated Cd274 (PDL1) expression, together with reduced expression of class II major histocompatibility complex transactivator (Ciita), Tyk2, and Cd96. Increased PDL1 expression on hematopoietic and immune cells enhances PD1-mediated inhibitory signaling, promoting T cell exhaustion and enabling tumor cells to evade immune surveillance (40,41). Meanwhile, reduced Ciita expression limits MHC class II–dependent antigen presentation, impairing CD4+ T cell priming (42); decreased Tyk2 blunts IFN-γ signaling, weakening Th1 differentiation and NK cell activity (43); and loss of Cd96 diminishes NK and T cell–mediated cytotoxicity (44). Treatment with either an anti–IL-17A antibody or a GLP-1R agonist alone produced only modest improvements in these defects. In contrast, Combo therapy showed reduced Pdl1 expression, alleviating T cell exhaustion and restoring effective T cell responses (Figure 12C). Concurrently, recovery of Ciita enhanced antigen presentation, increased Tyk2 expression, revitalized IFNG-dependent signaling to support Th1 and NK cell activity, and restored Cd96 expression, further strengthening NK and T cell–mediated surveillance. Importantly, expression of Cd3d, Cd4, and Cd8a was also robustly upregulated with Combo therapy, indicating reactivation of TCR signaling and improved CD4+ helper and CD8+ cytotoxic T cell function (Figure 12C). Flow cytometric analysis confirmed our findings that treatment with either an anti–IL-17A antibody or a GLP-1R agonist alone resulted in modest improvements and that Combo-treated mice had reduced T cell exhaustion, as evidenced by decreased TIM3+PD-1+ coexpression (Figure 13A), and showed increased enrichment of both CD4+ and CD8+ T cell subsets (Figure 13B). Together, these results demonstrate that dual GLP-1R agonism and IL-17A blockade not only suppressed obesity- and Shp2E76K/+-driven macrophage expansion and inflammatory reprogramming but also relieved T cell exhaustion and restored cytotoxic T cell immunity. This dual targeting strategy, therefore, acted at the intersection of metabolic dysfunction, myeloid-driven inflammation, and immune suppression, providing a powerful therapeutic avenue for controlling myeloproliferation in the context of obesity and oncogenic SHP2 signaling.
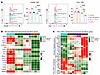 Figure 12
Combo therapy with a GLP-1R agonist and an anti–IL-17A antibody reduces M2-like macrophages in Ob/Ob mice bearing Shp2E76K/+ HSC/Ps. (A) Flow cytometry plots and quantification of F4/80+CD206+ and F4/80+Arg1+ M2-like TAMs in adipose tissue following vehicle or Combo therapy. (B) Heatmap showing expression of M2-associated macrophage markers and macrophage-regulatory genes across treatment groups. (C) Heatmap displaying expression of the PD-1/PD-L1 checkpoint pathway and immune-regulatory genes across treatment groups. n = 3–4 mice per group. *P < 0.05, **P < 0.005, ***P < 0.0005, and ****P < 0.0001, by 1-way ANOVA followed by Tukey’s post hoc test. Data are presented as the mean ± SEM.
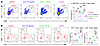 Figure 13
Combo therapy with a GLP-1R agonist and an anti–IL-17A antibody reduces T cell exhaustion and restore cytotoxic T cells in Ob/Ob mice bearing Shp2E76K/+-mutant HSC/Ps. (A) Flow cytometry plots and quantification of TIM3+PD-1+ exhausted T cells on CD8+ T cells in the spleens of Ob/Ob mice transplanted with Shp2E76K/+ HSC/Ps following the indicated drug treatment. (B) Flow cytometry plots and quantification of CD4+ and CD8+ T cell populations in the spleens of Ob/Ob mice transplanted with Shp2E76K/+ HSC/Ps following the indicated drug treatment. n = 3–4 mice per group, *P < 0.05, **P < 0.005, and ***P < 0.0005, by 1-way ANOVA followed by Tukey’s post hoc test. Data are presented as the mean ± SEM.


Copyright © 2026 American Society for Clinical Investigation
ISSN: 0021-9738 (print), 1558-8238 (online)