
Advertisement
Research ArticleCell biologyOncology
Open Access |  10.1172/JCI202218
Targeting CIC::DUX4 sarcoma with Minnelide in a dual recombinase–initiated genetically engineered mouse model
MaKenna R. Browne,1,2,3 Axel V. Silver,4 Risha Banerjee,4 Brendan C. Dickson,5,6 Benigno Aquino,3 Kristianne M. Oristian,7 Jonathon Himes,7 Peter G. Hendrickson,7 and David G. Kirsch3,4,7,8
1Cell and Molecular Biology Program, and
2Developmental and Stem Cell Biology Program, Duke University Medical Center, Durham, North Carolina, USA.
3Department of Radiation Oncology,
4Department of Medical Biophysics, and
5Department of Laboratory Medicine and Pathobiology, University of Toronto, Toronto, Ontario, Canada.
6Department of Pathology and Laboratory Medicine, Mount Sinai Hospital, Toronto, Ontario, Canada.
7Department of Radiation Oncology, Duke University Medical Center, Durham, North Carolina, USA.
8Radiation Medicine Program, Princess Margaret Cancer Centre, University Health Network, Toronto, Ontario, Canada.
Address correspondence to: Peter Hendrickson, Department of Radiation Oncology, University of Cincinnati, 3151 Bellevue Ave., Cincinnati, Ohio, 45219, USA. Phone: 513.584.3494; Email:hendripr@ucmail.uc.edu. Or to: David G. Kirsch, Department of Radiation Oncology, Princess Margaret Cancer Centre, 610 University Avenue, Toronto, Ontario, M5G 2M9, Canada. Phone: 416.946.2094; Email: david.kirsch@uhn.ca.
Find articles by Browne, M. in: PubMed | Google Scholar
1Cell and Molecular Biology Program, and
2Developmental and Stem Cell Biology Program, Duke University Medical Center, Durham, North Carolina, USA.
3Department of Radiation Oncology,
4Department of Medical Biophysics, and
5Department of Laboratory Medicine and Pathobiology, University of Toronto, Toronto, Ontario, Canada.
6Department of Pathology and Laboratory Medicine, Mount Sinai Hospital, Toronto, Ontario, Canada.
7Department of Radiation Oncology, Duke University Medical Center, Durham, North Carolina, USA.
8Radiation Medicine Program, Princess Margaret Cancer Centre, University Health Network, Toronto, Ontario, Canada.
Address correspondence to: Peter Hendrickson, Department of Radiation Oncology, University of Cincinnati, 3151 Bellevue Ave., Cincinnati, Ohio, 45219, USA. Phone: 513.584.3494; Email:hendripr@ucmail.uc.edu. Or to: David G. Kirsch, Department of Radiation Oncology, Princess Margaret Cancer Centre, 610 University Avenue, Toronto, Ontario, M5G 2M9, Canada. Phone: 416.946.2094; Email: david.kirsch@uhn.ca.
Find articles by Silver, A. in: PubMed | Google Scholar
1Cell and Molecular Biology Program, and
2Developmental and Stem Cell Biology Program, Duke University Medical Center, Durham, North Carolina, USA.
3Department of Radiation Oncology,
4Department of Medical Biophysics, and
5Department of Laboratory Medicine and Pathobiology, University of Toronto, Toronto, Ontario, Canada.
6Department of Pathology and Laboratory Medicine, Mount Sinai Hospital, Toronto, Ontario, Canada.
7Department of Radiation Oncology, Duke University Medical Center, Durham, North Carolina, USA.
8Radiation Medicine Program, Princess Margaret Cancer Centre, University Health Network, Toronto, Ontario, Canada.
Address correspondence to: Peter Hendrickson, Department of Radiation Oncology, University of Cincinnati, 3151 Bellevue Ave., Cincinnati, Ohio, 45219, USA. Phone: 513.584.3494; Email:hendripr@ucmail.uc.edu. Or to: David G. Kirsch, Department of Radiation Oncology, Princess Margaret Cancer Centre, 610 University Avenue, Toronto, Ontario, M5G 2M9, Canada. Phone: 416.946.2094; Email: david.kirsch@uhn.ca.
Find articles by Banerjee, R. in: PubMed | Google Scholar
1Cell and Molecular Biology Program, and
2Developmental and Stem Cell Biology Program, Duke University Medical Center, Durham, North Carolina, USA.
3Department of Radiation Oncology,
4Department of Medical Biophysics, and
5Department of Laboratory Medicine and Pathobiology, University of Toronto, Toronto, Ontario, Canada.
6Department of Pathology and Laboratory Medicine, Mount Sinai Hospital, Toronto, Ontario, Canada.
7Department of Radiation Oncology, Duke University Medical Center, Durham, North Carolina, USA.
8Radiation Medicine Program, Princess Margaret Cancer Centre, University Health Network, Toronto, Ontario, Canada.
Address correspondence to: Peter Hendrickson, Department of Radiation Oncology, University of Cincinnati, 3151 Bellevue Ave., Cincinnati, Ohio, 45219, USA. Phone: 513.584.3494; Email:hendripr@ucmail.uc.edu. Or to: David G. Kirsch, Department of Radiation Oncology, Princess Margaret Cancer Centre, 610 University Avenue, Toronto, Ontario, M5G 2M9, Canada. Phone: 416.946.2094; Email: david.kirsch@uhn.ca.
Find articles by Dickson, B. in: PubMed | Google Scholar
1Cell and Molecular Biology Program, and
2Developmental and Stem Cell Biology Program, Duke University Medical Center, Durham, North Carolina, USA.
3Department of Radiation Oncology,
4Department of Medical Biophysics, and
5Department of Laboratory Medicine and Pathobiology, University of Toronto, Toronto, Ontario, Canada.
6Department of Pathology and Laboratory Medicine, Mount Sinai Hospital, Toronto, Ontario, Canada.
7Department of Radiation Oncology, Duke University Medical Center, Durham, North Carolina, USA.
8Radiation Medicine Program, Princess Margaret Cancer Centre, University Health Network, Toronto, Ontario, Canada.
Address correspondence to: Peter Hendrickson, Department of Radiation Oncology, University of Cincinnati, 3151 Bellevue Ave., Cincinnati, Ohio, 45219, USA. Phone: 513.584.3494; Email:hendripr@ucmail.uc.edu. Or to: David G. Kirsch, Department of Radiation Oncology, Princess Margaret Cancer Centre, 610 University Avenue, Toronto, Ontario, M5G 2M9, Canada. Phone: 416.946.2094; Email: david.kirsch@uhn.ca.
Find articles by Aquino, B. in: PubMed | Google Scholar
1Cell and Molecular Biology Program, and
2Developmental and Stem Cell Biology Program, Duke University Medical Center, Durham, North Carolina, USA.
3Department of Radiation Oncology,
4Department of Medical Biophysics, and
5Department of Laboratory Medicine and Pathobiology, University of Toronto, Toronto, Ontario, Canada.
6Department of Pathology and Laboratory Medicine, Mount Sinai Hospital, Toronto, Ontario, Canada.
7Department of Radiation Oncology, Duke University Medical Center, Durham, North Carolina, USA.
8Radiation Medicine Program, Princess Margaret Cancer Centre, University Health Network, Toronto, Ontario, Canada.
Address correspondence to: Peter Hendrickson, Department of Radiation Oncology, University of Cincinnati, 3151 Bellevue Ave., Cincinnati, Ohio, 45219, USA. Phone: 513.584.3494; Email:hendripr@ucmail.uc.edu. Or to: David G. Kirsch, Department of Radiation Oncology, Princess Margaret Cancer Centre, 610 University Avenue, Toronto, Ontario, M5G 2M9, Canada. Phone: 416.946.2094; Email: david.kirsch@uhn.ca.
Find articles by Oristian, K. in: PubMed | Google Scholar
1Cell and Molecular Biology Program, and
2Developmental and Stem Cell Biology Program, Duke University Medical Center, Durham, North Carolina, USA.
3Department of Radiation Oncology,
4Department of Medical Biophysics, and
5Department of Laboratory Medicine and Pathobiology, University of Toronto, Toronto, Ontario, Canada.
6Department of Pathology and Laboratory Medicine, Mount Sinai Hospital, Toronto, Ontario, Canada.
7Department of Radiation Oncology, Duke University Medical Center, Durham, North Carolina, USA.
8Radiation Medicine Program, Princess Margaret Cancer Centre, University Health Network, Toronto, Ontario, Canada.
Address correspondence to: Peter Hendrickson, Department of Radiation Oncology, University of Cincinnati, 3151 Bellevue Ave., Cincinnati, Ohio, 45219, USA. Phone: 513.584.3494; Email:hendripr@ucmail.uc.edu. Or to: David G. Kirsch, Department of Radiation Oncology, Princess Margaret Cancer Centre, 610 University Avenue, Toronto, Ontario, M5G 2M9, Canada. Phone: 416.946.2094; Email: david.kirsch@uhn.ca.
Find articles by Himes, J. in: PubMed | Google Scholar
1Cell and Molecular Biology Program, and
2Developmental and Stem Cell Biology Program, Duke University Medical Center, Durham, North Carolina, USA.
3Department of Radiation Oncology,
4Department of Medical Biophysics, and
5Department of Laboratory Medicine and Pathobiology, University of Toronto, Toronto, Ontario, Canada.
6Department of Pathology and Laboratory Medicine, Mount Sinai Hospital, Toronto, Ontario, Canada.
7Department of Radiation Oncology, Duke University Medical Center, Durham, North Carolina, USA.
8Radiation Medicine Program, Princess Margaret Cancer Centre, University Health Network, Toronto, Ontario, Canada.
Address correspondence to: Peter Hendrickson, Department of Radiation Oncology, University of Cincinnati, 3151 Bellevue Ave., Cincinnati, Ohio, 45219, USA. Phone: 513.584.3494; Email:hendripr@ucmail.uc.edu. Or to: David G. Kirsch, Department of Radiation Oncology, Princess Margaret Cancer Centre, 610 University Avenue, Toronto, Ontario, M5G 2M9, Canada. Phone: 416.946.2094; Email: david.kirsch@uhn.ca.
Find articles by Hendrickson, P. in: PubMed | Google Scholar
1Cell and Molecular Biology Program, and
2Developmental and Stem Cell Biology Program, Duke University Medical Center, Durham, North Carolina, USA.
3Department of Radiation Oncology,
4Department of Medical Biophysics, and
5Department of Laboratory Medicine and Pathobiology, University of Toronto, Toronto, Ontario, Canada.
6Department of Pathology and Laboratory Medicine, Mount Sinai Hospital, Toronto, Ontario, Canada.
7Department of Radiation Oncology, Duke University Medical Center, Durham, North Carolina, USA.
8Radiation Medicine Program, Princess Margaret Cancer Centre, University Health Network, Toronto, Ontario, Canada.
Address correspondence to: Peter Hendrickson, Department of Radiation Oncology, University of Cincinnati, 3151 Bellevue Ave., Cincinnati, Ohio, 45219, USA. Phone: 513.584.3494; Email:hendripr@ucmail.uc.edu. Or to: David G. Kirsch, Department of Radiation Oncology, Princess Margaret Cancer Centre, 610 University Avenue, Toronto, Ontario, M5G 2M9, Canada. Phone: 416.946.2094; Email: david.kirsch@uhn.ca.
Find articles by
Kirsch, D.
in:
PubMed
|
Google Scholar
|

Published June 16, 2026 - More info
J Clin Invest. 2026;136(14):e202218. https://doi.org/10.1172/JCI202218.
© 2026 Browne et al. This work is licensed under the Creative Commons Attribution 4.0 International License. To view a copy of this license, visit http://creativecommons.org/licenses/by/4.0/.
Received: November 10, 2025; Accepted: May 28, 2026


-
Results
Dual-recombinase regulation of CIC::DUX4 expression results in a spatially and temporally restricted CDS mouse model. A barrier to preclinical investigation of alternative therapeutic approaches for CDS is the lack of an immunocompetent, autochthonous mouse model. Our laboratory previously attempted to develop a GEMM of CDS by targeting mouse embryonic stem (ES) cells using 3 different approaches that each regulated CIC::DUX4 expression with loxP-STOP-loxP cassettes (22). Remarkably, mice derived from the ES cells in all 3 models spontaneously developed aggressive and multifocal sarcomas in the absence of Cre recombinase, leading to rapid and early animal demise (22). Therefore, in these models, we were unable to control the timing or location of tumor formation, and it was not possible to breed the transgenic allele. To address these limitations, we developed a fourth CDS mouse model in which CIC::DUX4 expression required both Cre and FLP recombinases to conditionally invert 2 exons into the correct orientation and reading frame (Figure 1A). In the absence of Cre and FLP recombinases, a neomycin STOP cassette precedes an inverted exon 1 (CIC), SV40pA-KT3 stuffer sequence (pA), and inverted exon 2 (DUX4). Cre-mediated recombination inverts exon 1 into the same orientation as the CAG promoter and excises the neomycin STOP cassette. Following Cre recombination, the SV40pA-KT3 stuffer sequence remains intact, and the inverted exon 2 is out of frame. FLP-mediated recombination excises the SV40pA-KT3 stuffer sequence and inverts exon 2 into the same orientation and in frame with the remainder of the CIC::DUX4 transcript. Both Cre and FLP-mediated recombination are therefore required for CIC::DUX4 transgene expression (Figure 1A). Indeed, in the absence of Cre and FLP, the dFLEx CDS system prevented spontaneous tumor formation. Following electroporation of pCAG-Cre and pCAG-FLPE plasmids into the hind limbs of heterozygous and homozygous dFLEx CDS mice, spatially restricted tumors formed within 3 months at approximately 90% penetrance (Figure 1, B and C). H&E-stained sections (Figure 1, D–I, and Supplemental Figure 1, A–I; supplemental material available online with this article; https://doi.org/10.1172/JCI202218DS1) showed morphologically small, round cell tumors with strong expression of WT1, HA tag, and ETV4 (Figure 1, J and K) and patchy and/or focal immunoreactivity for desmin and CD99 (Supplemental Figure 1A); pancytokeratin was negative (Supplemental Figure 1A). Overall, the findings were broadly analogous to human CIC::DUX4 fusion–positive tumors (Figure 1, D–J). Furthermore, RNA-seq comparing the transcriptional profiles of the dFLEx CDS tumors versus sarcomas in KRASloxP-STOP-loxP-G12D Trp53fl/fl (KP) mice demonstrated that dFLEx CDS tumors expressed known CIC::DUX4 target genes (14, 22) such as Etv1/4/5, Dusp6, Shc3/4, and Spred3 (Supplemental Figure 1J). To assess whether dFLEx CDS tumors transcriptionally recapitulate human CDS, we conducted a cross-species transcriptomics comparison to evaluate the similarity between dFLEx CDS tumors and human sarcoma cell lines from the Cancer Dependency Map (DepMap) database. Remarkably, we found that dFLEx CDS tumors clustered together with the human CDS cell lines (Figure 1L), suggesting that dFLEx CDS tumors were transcriptionally similar to human CDS. Additionally, GSEA analysis revealed a strong correlation between dFLEx CDS tumors and human CDS cell lines (r = 0.87) in the enrichment of several notable driver oncogenic signaling pathways including MYC targets, mTOR, Notch, PI3K/AKT, and TGF-β signaling (Supplemental Figure 1K). PCR amplification across the loxP and FRT sites confirmed successful recombination by Cre and FLPE, respectively (Supplemental Figure 1L), and the CIC::DUX4 fusion protein was detected in dFLEx CDS tumors by Western blotting with antibodies against HA tag and DUX4 (Supplemental Figure 1M). Collectively, these results demonstrate that the use of 2 independent recombinase systems prevented spontaneous tumor formation in the absence of a recombinase, whereas electroporation of separate pCAG-Cre and pCAG-FLPE plasmids enabled spatially and temporally restricted sarcomas that mimicked human CDS.
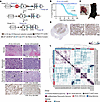 Figure 1
dFLEx CDS mice develop tumors only after expression of Cre and FLPE. (A) Schematic of the dFLEx CDS allele before and after recombination with Cre and FLPE. PCR primer sequences used to assess recombination (Supplemental Figure 1L) are indicated with Primer 1F/R and Primer 2F/R arrows. (B) Kaplan-Meier survival curve of dFLEx CDS mice showing no spontaneous tumor development without Cre and FLPE and approximately 90% tumor penetrance after electroporation of the hind limb muscle with plasmids expressing Cre plus FLPE. (C) Gross images of a hind limb tumor. (D–J) Representative photomicrographs highlighting histologic and immunohistochemical similarity between dFLEx CDS model and clinical examples of CIC::DUX4 sarcoma. (D and E) Necrosis in tumors originating from a dFLEx CDS mouse and the foot of a 22-year-old male individual (H&E; original magnification, ×100). (F and G) Sheets of monomorphic round cells, with occasional interspersed epithelioid cells, originating from a dFLEx CDS mouse and the shoulder of an 18-year-old female individual (H&E; original magnification, ×400). (H and I) Vague fascicles of monomorphic, round-ovoid cells with mitotic activity (arrowheads) and myxoid stroma originating from dFLEx CDS mouse and the thigh of a 14-year-old male individual (H&E; original magnification, ×400). (J) Diffuse nuclear staining for WT1 in cells from a dFLEx CDS mouse and a 22-year-old male individual (IHC; original magnification, ×200). (K) IHC of tumors formed in dFLEx CDS mice after electroporation of Cre plus FLPE plasmids for HA tag and ETV4 (scale bars: 50 μm). Supplemental Figure 1A shows an expanded staining panel; representative ETV4 and HA tag images from K are included again for completeness. (L) Pearson correlation of dFLEx CDS and KRASG12D Trp53fl/fl (KP) tumor transcriptional profiles to fusion-positive human sarcoma cell lines.
Single-nucleus RNA-seq of dFLEx CDS tumors. Next, to better characterize intertumoral properties and the tumor microenvironment, we conducted single nucleus RNA-seq (snRNA-seq) on 4 dFLEx CDS tumors using 10X Genomics Sequencing (Figure 2A). After quality control and doublet removal, a total of 15,923 cells were retained for unsupervised clustering on the basis of the top variably expressed genes (Figure 2B and Supplemental Figure 2A). Given the expression of CIC::DUX4 target genes Etv1, Etv4, Etv5, Shc3, Shc4, Dusp4, Vgf, and Spred2 (Supplemental Figure 2, B and C), clusters 1 and 5 were annotated as CIC::DUX4 tumor cells, whereas the remaining clusters were assigned using canonical marker genes (Supplemental Figure 2B) and corresponded to fibroblasts, pericytes, macrophages, endothelial cells, and myocytes (Figure 2B). The relative proportions of each cluster were broadly similar across all 4 tumors, with CIC::DUX4 sarcoma cells comprising the majority (45%–70%) of cells within each tumor (Figure 2C).
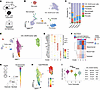 Figure 2
Single-nucleus transcriptional profiling of dFLEx CDS tumors. (A) Schematic of snRNA-seq workflow. Single nuclei suspensions for snRNA-seq were prepared from 4 dFLEx CDS tumors. (B) UMAP plots of tumor and nontumor cells (n = 15,923) in dFLEx CDS tumors (n = 4). Cell types were assigned using the expression of canonical marker genes (Supplemental Figure 2B). (C) Bar plots showing the cluster composition in each tumor. (D) UMAP plot of tumor cells only. (E) Dot plot highlighting marker gene expression in tumor subclusters. (F) Heatmap demonstrating the correlation between tumor subclusters and MOCA developmental trajectories. (G) Adapted schematic of the CytoTRACE2 deep learning model (29). CytoTRACE2 predicts cellular potency and developmental potential based on gene expression profiles. (H) UMAP of CytoTRACE2 scores. Clusters with higher CytoTRACE2 scores are predicted to have higher differentiation potential and be less differentiated. (I) CIC::DUX4 activity in each tumor subcluster based on the expression of CIC::DUX4 target genes and genes highly expressed in CDS tumors. Brackets indicate significance by 1-sided Wilcoxon rank-sum test with Benjamini-Hochberg (BH) correction. Effect sizes (rank-biserial r): cluster 3 vs. 1, r = 0.97; vs. 2, r = 1.00; vs. 4, r = 0.85. ****P < 0.0001.
To further investigate characteristics of the CIC::DUX4 tumor cells, tumor cell clusters 1 and 5 were subclustered, revealing 4 subclusters (Figure 2D and Supplemental Figure 2D). Subcluster-level differential expression analysis (FDR < 0.05, log fold change [FC] > 0.5) revealed that cluster 2 was enriched for genes associated with self-renewal and stemness, cluster 3 was strongly enriched for endothelial cell–associated genes such as Pecam1, Erg, and Cdh5, and cluster 4 was enriched for mesenchymal cell–associated genes (Figure 2E). Comparison of the tumor cell transcriptional profiles to the Mouse Organogenesis Cell Atlas (MOCA) reference dataset (24) revealed subclusters 1, 2, and 4 most closely correlated to the mesenchymal trajectory, whereas cluster 3 strongly correlated to the endothelial cell trajectory (Figure 2F). Interestingly, a single-cell study of human CDS tumors also recently reported tumor cell populations with endothelial cell–like transcriptional features (25), and clinically, there are several reports of histologically unique CIC::DUX4 sarcomas with angiosarcoma-like features including ERG/CD31 expression (26–29).
Given the histologic undifferentiated nature of both human CDS and dFLEx CDS tumors, we next wondered if we could make inferences about the cellular potency and developmental potential of the different tumor subclusters. Using the deep learning model CytoTRACE2 (30) to characterize the developmental state of dFLEx CDS tumor cells (Figure 2G), we found that most tumor cells had moderate CytoTRACE2 scores. However, cells in subcluster 2 had higher scores, whereas cells in subcluster 3 had lower scores (Figure 2H), suggesting diversity in developmental potential across tumor cell populations. Notably, tumor cluster 5, which gives rise to tumor subcluster 3, displayed lower activation of the CIC::DUX4 transcriptional program when compared with cluster 1 (Supplemental Figure 2, B and C). Given these observations, we next wondered if there is an association between developmental potential and CIC::DUX4 activity. To assess this, we generated a CIC::DUX4 activity score based on known CIC::DUX4 target genes and found that, indeed, the tumor subcluster with the lowest CytoTRACE2 score (subcluster 3) also had reduced CIC::DUX4 activity (Figure 2I).
Minnelide kills CIC::DUX4 sarcoma cells through induction of apoptosis. Following the development of the dFLEx CDS model, we aimed to identify and evaluate alternative therapeutic interventions for CDS using this platform. Considering that CIC::DUX4 interacts with acetyltransferase p300/CBP to activate a unique oncogenic transcriptional program (14, 16), we sought to test the efficacy of compounds that modulate transcription or selectively target epigenetic writers and erasers. To this end, we performed cell viability screens in 3 human CDS cell lines (Kitra-SRS, CDS2, X1C1) at 4 concentrations (1 nm, 10 nm, 100 nm, and 1,000 nM) using a library of 160 small-molecule inhibitors (Figure 3A and Supplemental Figure 3A). This drug screen not only identified dinaciclib, a transcriptional modulator previously shown to have efficacy in CDS models (12), but also revealed a sensitivity to triptolide, starting in the 10 nM range (Figure 3A and Supplemental Figure 3A). Although triptolide has demonstrated robust antitumor effects in a variety of preclinical cancer models (31–41), the clinical utility of triptolide is limited by its poor solubility in water. Therefore, a water-soluble prodrug of triptolide called Minnelide was developed (42). Minnelide rapidly releases triptolide when exposed to phosphatases present in both tissues and in the blood in vivo (42) or in FBS in vitro. Importantly, Minnelide has been successfully tested in phase I and II clinical trials for advanced gastrointestinal (GI) carcinoma and pancreatic cancer (43, 44) and is currently being studied in ongoing clinical trials of gastric cancer (NCT05566834) and small-cell lung cancer (NCT05166616). To validate our screen results and to test the efficacy of Minnelide in CDS cells relative to other small, round-cell sarcoma cell lines, we performed CellTiter-Glo assays. After 48 hours of treatment, the CDS cell lines Kitra-SRS, ECD1, TOPCDS, and CDS#2 exhibited reduced viability compared with Ewing sarcoma (A-673), fusion-positive rhabdomyosarcoma (Rh-4), and WT mouse embryonic fibroblasts (WT MEFs) (Figure 3B). Notably, our drug screen revealed that triptolide reduced X1C1 CDS cell viability less effectively at 10 nM than in the other CDS cell lines included in the screen (Figure 3A). Similarly, the X1C1 cell line demonstrated lower sensitivity to Minnelide relative to the other CDS cell lines tested (Figure 3B). These results suggest that Minnelide and triptolide have similar efficacy patterns in human CDS cell lines.
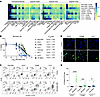 Figure 3
Minnelide induces apoptosis in CDS cells. (A) Viability drug screen on human CDS cells (Kitra-SRS, CDS#2 and X1C1) using the Tocriscreen Epigenetics 3.0 compound library. (B) CellTiter-Glo on CDS cells (Kitra-SRS, ECD1, CDS#2, X1C1, and TOPCDS mouse CDS cell lines [ref. 22]) and non-CDS cells (Rh-4, A-673, WT MEFs) treated with 0–200 nM Minnelide for 48 hours. (C) Annexin V/PI flow cytometry on Kitra-SRS, ECD1, CDS#2, and X1C1 CDS cells treated with Minnelide for 48 hours. (D) CC3 immunofluorescence of human CDS cells (ECD1, CDS#2, X1C1) treated with Minnelide for 48 hours. Scale bars: 50 μm. (E) Quantification of the percentage of CC3+ cells. A total of 9–10 regions per condition were quantified, including regions sampled from 3 independent experiments. ***P < 0.001 and ****P < 0.0001, by 2-tailed exact Mann-Whitney U test. Data are presented as the mean ± SEM.
Previous studies have shown Minnelide and triptolide induce apoptosis in some cancer cell types and autophagy in others (34–36, 39, 40, 45–48). To explore the mechanism of cell death in CDS cells, we treated Kitra-SRS, ECD1, and CDS#2 human CDS cells with 25 nM Minnelide for 48 hours and treated X1C1 human CDS cells with 70 nM Minnelide for 48 hours, and then performed annexin V/propidium iodide (PI) flow cytometry. In all cell lines tested, Minnelide treatment resulted in an increase of annexin V+/PI– cells, indicating early apoptosis (Figure 3C). Additionally, after 48 hours, we observed an increase in cleaved caspase-3 (CC3) expression (Figure 3, D and E) and a decrease in EdU incorporation (Supplemental Figure 3B) further suggesting Minnelide induces apoptosis in CDS cells.
Minnelide targets xeroderma pigmentosum type B, leading to RPB1 degradation and inhibition of transcription. Previous studies have shown that Minnelide/triptolide directly binds to xeroderma pigmentosum type B (XPB), a subunit of transcription factor II H (TFIIH), which is a general transcription factor of RNA polymerase II (RNAP II) (37, 49–51). In this working model, upon binding, Minnelide inhibits XPB’s ATPase activity, leading to stalling of RNAP II at gene promoters and inhibition of sustained transcription. Prolonged stalling of RNAP II can result in altered phosphorylation patterns on RPB1, the largest subunit of RNAP II, leading to its ubiquitination and proteasome-mediated degradation (49–51) (Figure 4A). Consistent with this model, after treating human CDS cells with 25 nM Minnelide for 48 hours, we observed depletion of RPB1 in Kitra-SRS, ECD1, and CDS#2 human CDS cell lines (Figure 4B) and a near complete loss in the X1C1 cells after treating them with 70 nM Minnelide for 48 hours (Supplemental Figure 4A). Furthermore, after 6–26 hours of Minnelide treatment, we observed an initial increase in RPB1 phosphorylation at Ser5 (marking transcriptional initiation), whereas RPB1 phosphorylation at Ser2 (marking transcriptional elongation) was maintained (Figure 4, C and D, and Supplemental Figure 4B). By 26 hours, total RPB1 levels were reduced (Figure 4C and Supplemental Figure 4B). To determine whether the RPB1 reduction was due to proteasome-mediated degradation, CDS cells were cotreated with 10 mM Minnelide and 10 mM expoxomicin, a proteasome inhibitor. Cotreatment with epoxomicin partially rescued the Minnelide-mediated decrease in RPB1 expression (Figure 4E and Supplemental Figure 4C), suggesting that Minnelide treatment led to the proteasome-mediated degradation of RPB1 in CDS cells. Next, to test the model that Minnelide regulates RPB1 degradation via XPB, a Minnelide-resistant, XPB mutant (51) (XPB C342T) was expressed in human CDS cells (Supplemental Figure 4D). Human CDS cells expressing XPB C342T not only retained RPB1 expression after 48 hours of Minnelide treatment (Figure 4F) but also showed a higher tolerance to Minnelide across increasing concentrations (Figure 4G). Taken together, these results suggest that Minnelide targeted XPB, leading to RNAP II stalling and subsequent RPB1 degradation, thus inhibiting CDS cell viability.
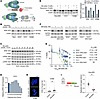 Figure 4
Minnelide targets XPB, leading to RPB1 degradation and transcriptional inhibition. (A) Schematic showing Minnelide inhibition of RNAP II. Minnelide directly binds XPB. Inhibition of XPB’s ATPase activity leads to stalling of RNAP II at gene promoters and inhibition of transcription. Prolonged stalling of RNAP II results in altered phosphorylation patterns on RPB1, ubiquitination, and then proteasome-mediated degradation of RPB1. (B) Western blot of RPB1 expression in human CDS cells (Kitra-SRS, ECD1, X1C1, and CDS#2) after treatment with 25 nM Minnelide for 48 hours. (C) Western blot of RPB1 expression and p-RPB1 over a time course of Minnelide treatment in human ECD1 cells. (D) Quantification of p-RPB1 (Ser5) expression (E) Western blot demonstrating that the proteasome inhibitor epoxomicin partially rescued Minnelide-mediated RPB1 degradation in CDS cells (Kitra-SRS, X1C1, CDS#2). (F) Western blot demonstrating that the expression of XPB C342T in Kitra-SRS, ECD1, and X1C1 human CDS cells rescued Minnelide-mediated RPB1 degradation. GAPDH was used as the loading control for Kitra-SRS and ECD1 cells, whereas β-actin was used as the loading control for X1C1 cells. (G) CellTiter-Glo assay demonstrated that human CDS cells expressing XPB C342T had increased resistance to Minnelide. (H) γH2A.X immunofluorescence on human CDS#2 cells treated with Minnelide for 48 hours. Scale bars: 5 μm. At least 50 nuclei per condition were quantified, including nuclei sampled from 4 independent experiments. *P < 0.05, by 2-tailed exact Mann-Whitney U test. (I) DNA fiber assay on human Kitra-SRS cells treated with Minnelide (Minn) for 48 hours. Ctrl, control. At least 100 fibers per condition were quantified, including fibers sampled from 4 independent experiments. *P < 0.05, by 2-tailed, exact Mann-Whitney U test. Data are presented as the mean ± SEM.
A consequence of RNAP II stalling can be the accumulation of double-stranded breaks and an increase in transcription-replication conflicts leading to replication stress (52–55). Considering that CIC::DUX4 sarcoma cells use specific mechanisms to promote DNA repair and tolerance to elevated replication stress (12, 19, 56), we wondered if Minnelide treatment further increases DNA damage and replication stress, potentially contributing to Minnelide-mediated cell death. Forty-eight hours after Minnelide treatment, we observed an increase in γH2AX foci and protein expression (Figure 4H and Supplemental Figure 4, E and F), indicating an increase in DNA double-stranded breaks. Furthermore, DNA fiber analysis revealed that 48 hours of Minnelide treatment significantly decreased replication fork speed, indicating replication stress (Figure 4I and Supplemental Figure 4G).
RPB1 loss coincides with the onset of Minnelide-induced cell death. Following RPB1 degradation, there are several potential pathways to induce cell death. One possibility is that inhibition of transcription leads to widespread mRNA decay over time, with progressive loss of essential proteins, which results in a passive form of cell death termed accidental cell death (57). A second possibility is that inhibition of transcription leads to the loss of expression of essential genes that are specifically regulated by CIC::DUX4, similar to G3 medulloblastoma (G3 MB), in which Minnelide-induced cell death occurs, in part, through an early (2–8 hours) reduction of the G3 MB dependency gene, MYC (37). Alternatively, a recent elegant study demonstrated that degradation of RPB1 itself can trigger apoptosis through a transcription-independent mechanism, termed the Pol II degradation–dependent apoptotic response (58). Given that CDS is dependent on an aberrantly activated transcriptional program, we initially hypothesized that, similar to what is seen with G3 MB, loss of expression of essential genes would be a key driver of cell death following Minnelide treatment. We started by treating human CDS cells (Kitra-SRS) with 25 nM Minnelide for 2, 4, 8, 12, 24, 48, and 72 hours and then conducted bulk RNA-seq (Figure 5A) to assess Minnelide-induced transcriptional changes over time. Notably, few transcriptional changes seemed to occur at the early treatment time points (2–4 hours); instead, most changes occurred between the mid-to-late treatment times (Figure 5B). Surprisingly, only a very small subset of CIC::DUX4 target genes emerged as top downregulated genes following 2–24 hours of Minnelide treatment. Target genes such as DUSP4, VGF, and MYC were downregulated at 24 hours, (Figure 5C), however, the majority of CDS target genes, including ETV1/4/5, remained relatively unchanged until 72 hours (Supplemental Figure 5A). In line with these results, CIC::DUX4 fusion expression was retained after both 24 and 48 hours of Minnelide treatment (Supplemental Figure 5B). Next, to evaluate if the late timing of target gene expression loss coincides with the onset of cell death, we conducted fluorescence-based and lysis-dependent inference of cell death kinetics (FLICK) (59) and determined that the onset of cell death occurred between 18 and 25 hours following the addition of Minnelide (Figure 5D and Supplemental Figure 5C). Furthermore, 5-ethynyl uridine (EU) incorporation 24, 48, and 72 hours after Minnelide treatment revealed that there were no major shifts in nascent transcription at 24 hours (Figure 5E and Supplemental Figure 5D), suggesting that the onset of cell death in CDS cells was not initially due to global loss of transcription. Instead, the onset of cell death closely coincided with the loss of RPB1 (Figure 4C and Supplemental Figure 4B), suggesting that RPB1 loss may have been triggering cell death in a transcription-independent manner (58). Previous studies in U2OS cells have found that degradation of RNAP II shifts the localization of BCL2L12 from the nucleus to mitochondria via a polypyrimidine tract–binding protein 1–dependent (PTBP1-dependent) mechanism to trigger the intrinsic pathway of apoptosis (58). While we were able to detect cytoplasmic translocation of PTBP1 in U2OS cells similar to a previous report (58), we did not detect PTBP1 translocation in human CDS cells after Minnelide treatment (Figure 5, F and G, and Supplemental Figure 5E). Collectively these results suggest that there are PTBP1-independent mechanisms triggering cell death following RPB1 degradation.
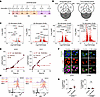 Figure 5
Minnelide induces cell death independent of transcriptional inhibition. (A) Schematic for the Minnelide time course in Kitra-SRS human CDS cells. (B) Venn diagrams representing transcriptional changes during early, mid, and late Minnelide treatment times. (C) Volcano plots demonstrating transcriptional changes following Minnelide treatment as a function of time. (D) FLICK assays on human ECD1 and X1C1 cells demonstrating that the onset of cell death was 22.54 hours and 18.65 hours after the start of Minnelide treatment, respectively. (E) EU incorporation 24, 48, and 72 hours after Minnelide treatment to assess changes in nascent transcription in ECD1 and X1C1 cells. (F) PTBP1 immunofluorescence on human CDS#2 cells after 48 hours Minnelide treatment. U2OS osteosarcoma cells were used as a positive control. Scale bars: 15 μm. (G) Quantification of cells with cytoplasmic PTBP1. A total of 24–25 regions per condition were quantified, including regions sampled from 5 independent experiments. *P < 0.05, by 2-tailed exact Mann-Whitney U test. Data are presented as the mean ± SEM.
Minnelide treatment significantly reduces tumor growth in human CDS xenograft models. To test the clinical potential of Minnelide in CDS, human CDS cells (Kitra-SRS and ECD1) were s.c. transplanted into NOD-SCID IL2Rγ-null (NSG) mice. Once tumors were palpable (~200–300 mm3), mice were treated with Minnelide via i.p. injection once daily for 21 consecutive days. Dose selection was informed by the recommended starting dose and maximum tolerated dose reported in the phase I Minnelide clinical trial for GI carcinoma (43). Treatment with both 0.21 mg/kg and 0.27 mg/kg Minnelide, which approximates (60) the human dose of 0.67 mg/m2 and 0.80 mg/m2 (Figure 6A), significantly reduced tumor growth of xenografts from both of the human CDS cell lines tested (Figure 6, B and C, and Supplemental Figure 6A). Notably, a 21-day treatment course with 0.27 mg/kg resulted in sustained tumor control, with no recurrence observed through 50 days (Supplemental Figure 6, B and C).
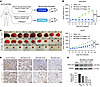 Figure 6
Minnelide reduces tumor growth in human CDS xenograft models. (A) Dose selection was informed by the recommended starting dose and maximum tolerated dose reported in the phase I Minnelide clinical trial for GI carcinoma (NCT01927965). Doses of 0.21 mg/kg and 0.27 mg/kg approximate the human doses of 0.67 mg/m2 and 0.80 mg/m2, respectively. (B) NSG mice were inoculated with Kitra-SRS or ECD1 human CDS cells and then treated with Minnelide at a dose of 0.21 mg/kg or 0.27 mg/kg daily for 21 days. Tumor growth was significantly reduced in the Minnelide-treated groups compared with controls. Data are presented as the mean ± SEM. *P < 0.05, **P < 0.01, and ****P < 0.0001, by 1-way ANOVA at day 21. (C) Gross morphology of Kitra-SRS dissected tumors at the humane endpoint or at day 21 of treatment. (D) Ki67 and p-RPB1 Ser2/5 IHC on sections from saline- and Minnelide-treated Kitra-SRS CDS xenograft tumors at 14, 18, and 21 days of Minnelide treatment. Scale bars: 50 μm. (E) Western blot of RPB1 expression in Kitra-SRS CDS xenograft tumors over a 21-day treatment period with 0.27 mg/kg Minnelide daily and quantification of RPB1 expression relative to GAPDH loading control. D14, day 14; D18, day 18; D21, day 21.
Immunohistochemical staining on Minnelide xenograft tumor tissues demonstrated a reduction in Ki67 staining over the 21-day treatment period, and reduced expression of phosphorylated RPB1 (p-RPB1) at Ser2/5, indicating decreased RNAP II initiation and elongation and suggesting that active transcription was impaired (Figure 6D). Furthermore, Western blot analysis of xenograft tumors demonstrated a reduction in RPB1 expression (Figure 6E). Consistent with previous studies (37, 49, 51) and our in vitro results (Figure 4), these findings suggest that Minnelide treatment induced RPB1 degradation and inhibition of transcription in human CDS xenograft tumors.
Minnelide treatment reduces tumor growth in a subset of dFLEx CDS mice. Next, to test the efficacy of Minnelide against CDS in an immunocompetent, autochthonous setting, we leveraged our dFLEx CDS model. pCAG-Cre and pCAG-FLPE plasmids were electroporated into the hind limb muscle of dFLEx CDS mice. Once tumors were palpable (~40 days after electroporation), mice were treated daily for 21 days with either 0.42 mg/kg Minnelide, 0.27 mg/kg Minnelide, or vehicle control (saline), or once weekly with 3 mg/kg doxorubicin. Dose selection in this mouse study was informed by previous preclinical studies using Minnelide (37, 42, 61) and the maximum tolerated dose reported in the phase I Minnelide clinical trial for GI cancers (43). A dose of 0.27 mg/kg Minnelide approximates 0.80 mg/m2 in patients (60) and has been successfully used in the phase I Minnelide clinical trial for GI cancers (43). Of note, at baseline, tumors from the dFLEx CDS model were very aggressive and grew rapidly. Tumors in the saline control group progressed from palpable to endpoint (~2,000 mm3) in 14–20 days (Figure 7, A and B). Treatment with doxorubicin, a backbone therapy in the Ewing chemotherapy regimen, resulted in reduced tumor growth in approximately 23% of mice (3 of 13), while treatment with 0.27 mg/kg and 0.42 mg/kg Minnelide resulted in a marked response in approximately 39% (9 of 23) and approximately 52% (11 of 21) of mice, respectively (Figure 7, A and B) without any appreciable toxicity. Furthermore, treatment with both 0.42 mg/kg and 0.27 mg/kg Minnelide increased the percentage of mice with tumors of less than 1,500 mm3 in volume at day 21 (Figure 7C). Collectively these results suggest that the dFLEx CDS model can be leveraged for preclinical testing of therapeutic alternatives for CDS and that Minnelide showed efficacy in multiple CDS preclinical mouse models.
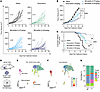 Figure 7
Minnelide reduces tumor growth in vivo in autochthonous sarcomas in dFLEx CDS mice. (A) Spider plots demonstrating tumor growth rates in groups treated with control (saline), 3 mg/kg doxorubicin, (0.27 mg/kg), or (0.42 mg/kg) Minnelide over 21 days. (B) Comparison of tumor growth across treatment groups. Data are presented as the mean ± SEM. Statistical comparisons were performed at day 21 only. *P < 0.05 and ****P < 0.0001, by 2-way ANOVA. (C) Kaplan-Meier curves indicating the time to 1,500 mm3 tumor volume. **P < 0.01 and ****P < 0.0001, by log-rank (Mantel-Cox) test. (D) Schematic of snRNA-seq workflow. Single-nuclei suspensions for snRNA-seq were prepared from 4 dFLEx CDS tumors treated with 0.42 mg/kg Minnelide for 21 days. (E) UMAP plots of tumor and nontumor cells in dFLEx CDS tumors (n = 4). Cell types were assigned using the expression of canonical marker genes. (F) UMAP of CytoTRACE2 scores. Tumor cluster 3 demonstrated the highest CytoTRACE2 score. (G) Cluster composition of dFLEx CDS tumors that demonstrated an unfavorable response (NR) to Minnelide compared with tumors that demonstrated a better response (R) to Minnelide. Overall cluster composition differed significantly between responders and nonresponders (χ2 test, P = 6.1 × 10–173). Three clusters were differentially enriched after FDR correction (denoted by an asterisk): clusters 1 and 3 were enriched in nonresponders (OR = 1.58 and 1.54), while cluster 4 was strongly enriched in responders (OR = 0.035).
To generate potential hypotheses for why some dFLEx CDS mice respond better to Minnelide than others, we conducted snRNA-seq on dFLEx CDS tumors that demonstrated either a favorable response or a poor response after 0.42 mg/kg Minnelide (Figure 7D and Supplemental Figure 7A). After unsupervised clustering based on the top variably expressed genes, we identified 6 clusters (Figure 7E and Supplemental Figure 7B), 3 of which (clusters 1, 3, and 5) were identified as CIC::DUX4 tumor cells on the basis of their expression of the CIC::DUX4 target genes Etv1, Etv4, Etv5, Shc3, Shc4, and Ccnd2 (Supplemental Figure 7C). Using CytoTRACE2 to predict the cellular potency and developmental potential of sequenced cells, we identified tumor cluster 3 as the least differentiated and most stem like (Figure 7F). Interestingly, when we compared the cluster composition of tumors that had a poorer response to 0.42 mg/kg Minnelide (NR) with tumors that had a more favorable response (R), we found that NR tumors had a higher proportion of cluster 3 CIC::DUX4 tumor cells (Figure 7G). These results suggest that a potential mechanism of resistance could be the relative differentiation state of the tumor.


Copyright © 2026 American Society for Clinical Investigation
ISSN: 0021-9738 (print), 1558-8238 (online)