
Advertisement
Research ArticleImmunologyOncology
Open Access |  10.1172/JCI201816
Tumor NLRP3 amplification promotes immunotherapy resistance by inhibiting STAT1 signaling and MHC class I expression
Balamayroon Theivanthiran,1 Nagendra Yarla,2 Kaylee Villarreal,2 Y-Van Nguyen,1 Mahere Rezazade Bazaz,1 Ernesto Pena Calderin,1 Linda Cao,1 Kyra Majors,1 Michael P. Plebanek,1 Alisha Holtzhausen,3 Emily Bolch,2 Douglas B. Johnson,4 Hope Uronis,2 John H. Strickler,2 Nicholas C. DeVito,2 and Brent A. Hanks1,3
1Lineberger Comprehensive Cancer Center, Department of Medicine, Division of Medical Oncology, Department of Microbiology and Immunology, UNC School of Medicine, University of North Carolina at Chapel Hill, Chapel Hill, North Carolina, USA.
2Duke Cancer Institute, Department of Medicine, Division of Medical Oncology, Duke University, Durham, North Carolina, USA.
3Department of Pharmacology, UNC School of Medicine, University of North Carolina at Chapel Hill, Chapel Hill, North Carolina, USA.
4Department of Medicine, Vanderbilt University Medical Center, Nashville, Tennessee, USA.
Address correspondence to: Brent A. Hanks, Lineberger Comprehensive Cancer Center, University of North Carolina, 450 West Drive, CB# 7295, Chapel Hill, North Carolina 27599, USA. Email: Brent_Hanks@med.unc.edu.
Find articles by Theivanthiran, B. in: PubMed | Google Scholar
1Lineberger Comprehensive Cancer Center, Department of Medicine, Division of Medical Oncology, Department of Microbiology and Immunology, UNC School of Medicine, University of North Carolina at Chapel Hill, Chapel Hill, North Carolina, USA.
2Duke Cancer Institute, Department of Medicine, Division of Medical Oncology, Duke University, Durham, North Carolina, USA.
3Department of Pharmacology, UNC School of Medicine, University of North Carolina at Chapel Hill, Chapel Hill, North Carolina, USA.
4Department of Medicine, Vanderbilt University Medical Center, Nashville, Tennessee, USA.
Address correspondence to: Brent A. Hanks, Lineberger Comprehensive Cancer Center, University of North Carolina, 450 West Drive, CB# 7295, Chapel Hill, North Carolina 27599, USA. Email: Brent_Hanks@med.unc.edu.
Find articles by Yarla, N. in: PubMed | Google Scholar
1Lineberger Comprehensive Cancer Center, Department of Medicine, Division of Medical Oncology, Department of Microbiology and Immunology, UNC School of Medicine, University of North Carolina at Chapel Hill, Chapel Hill, North Carolina, USA.
2Duke Cancer Institute, Department of Medicine, Division of Medical Oncology, Duke University, Durham, North Carolina, USA.
3Department of Pharmacology, UNC School of Medicine, University of North Carolina at Chapel Hill, Chapel Hill, North Carolina, USA.
4Department of Medicine, Vanderbilt University Medical Center, Nashville, Tennessee, USA.
Address correspondence to: Brent A. Hanks, Lineberger Comprehensive Cancer Center, University of North Carolina, 450 West Drive, CB# 7295, Chapel Hill, North Carolina 27599, USA. Email: Brent_Hanks@med.unc.edu.
Find articles by Villarreal, K. in: PubMed | Google Scholar
1Lineberger Comprehensive Cancer Center, Department of Medicine, Division of Medical Oncology, Department of Microbiology and Immunology, UNC School of Medicine, University of North Carolina at Chapel Hill, Chapel Hill, North Carolina, USA.
2Duke Cancer Institute, Department of Medicine, Division of Medical Oncology, Duke University, Durham, North Carolina, USA.
3Department of Pharmacology, UNC School of Medicine, University of North Carolina at Chapel Hill, Chapel Hill, North Carolina, USA.
4Department of Medicine, Vanderbilt University Medical Center, Nashville, Tennessee, USA.
Address correspondence to: Brent A. Hanks, Lineberger Comprehensive Cancer Center, University of North Carolina, 450 West Drive, CB# 7295, Chapel Hill, North Carolina 27599, USA. Email: Brent_Hanks@med.unc.edu.
Find articles by Nguyen, Y. in: PubMed | Google Scholar
1Lineberger Comprehensive Cancer Center, Department of Medicine, Division of Medical Oncology, Department of Microbiology and Immunology, UNC School of Medicine, University of North Carolina at Chapel Hill, Chapel Hill, North Carolina, USA.
2Duke Cancer Institute, Department of Medicine, Division of Medical Oncology, Duke University, Durham, North Carolina, USA.
3Department of Pharmacology, UNC School of Medicine, University of North Carolina at Chapel Hill, Chapel Hill, North Carolina, USA.
4Department of Medicine, Vanderbilt University Medical Center, Nashville, Tennessee, USA.
Address correspondence to: Brent A. Hanks, Lineberger Comprehensive Cancer Center, University of North Carolina, 450 West Drive, CB# 7295, Chapel Hill, North Carolina 27599, USA. Email: Brent_Hanks@med.unc.edu.
Find articles by Rezazade Bazaz, M. in: PubMed | Google Scholar
1Lineberger Comprehensive Cancer Center, Department of Medicine, Division of Medical Oncology, Department of Microbiology and Immunology, UNC School of Medicine, University of North Carolina at Chapel Hill, Chapel Hill, North Carolina, USA.
2Duke Cancer Institute, Department of Medicine, Division of Medical Oncology, Duke University, Durham, North Carolina, USA.
3Department of Pharmacology, UNC School of Medicine, University of North Carolina at Chapel Hill, Chapel Hill, North Carolina, USA.
4Department of Medicine, Vanderbilt University Medical Center, Nashville, Tennessee, USA.
Address correspondence to: Brent A. Hanks, Lineberger Comprehensive Cancer Center, University of North Carolina, 450 West Drive, CB# 7295, Chapel Hill, North Carolina 27599, USA. Email: Brent_Hanks@med.unc.edu.
Find articles by Pena Calderin, E. in: PubMed | Google Scholar
1Lineberger Comprehensive Cancer Center, Department of Medicine, Division of Medical Oncology, Department of Microbiology and Immunology, UNC School of Medicine, University of North Carolina at Chapel Hill, Chapel Hill, North Carolina, USA.
2Duke Cancer Institute, Department of Medicine, Division of Medical Oncology, Duke University, Durham, North Carolina, USA.
3Department of Pharmacology, UNC School of Medicine, University of North Carolina at Chapel Hill, Chapel Hill, North Carolina, USA.
4Department of Medicine, Vanderbilt University Medical Center, Nashville, Tennessee, USA.
Address correspondence to: Brent A. Hanks, Lineberger Comprehensive Cancer Center, University of North Carolina, 450 West Drive, CB# 7295, Chapel Hill, North Carolina 27599, USA. Email: Brent_Hanks@med.unc.edu.
Find articles by Cao, L. in: PubMed | Google Scholar
1Lineberger Comprehensive Cancer Center, Department of Medicine, Division of Medical Oncology, Department of Microbiology and Immunology, UNC School of Medicine, University of North Carolina at Chapel Hill, Chapel Hill, North Carolina, USA.
2Duke Cancer Institute, Department of Medicine, Division of Medical Oncology, Duke University, Durham, North Carolina, USA.
3Department of Pharmacology, UNC School of Medicine, University of North Carolina at Chapel Hill, Chapel Hill, North Carolina, USA.
4Department of Medicine, Vanderbilt University Medical Center, Nashville, Tennessee, USA.
Address correspondence to: Brent A. Hanks, Lineberger Comprehensive Cancer Center, University of North Carolina, 450 West Drive, CB# 7295, Chapel Hill, North Carolina 27599, USA. Email: Brent_Hanks@med.unc.edu.
Find articles by Majors, K. in: PubMed | Google Scholar
1Lineberger Comprehensive Cancer Center, Department of Medicine, Division of Medical Oncology, Department of Microbiology and Immunology, UNC School of Medicine, University of North Carolina at Chapel Hill, Chapel Hill, North Carolina, USA.
2Duke Cancer Institute, Department of Medicine, Division of Medical Oncology, Duke University, Durham, North Carolina, USA.
3Department of Pharmacology, UNC School of Medicine, University of North Carolina at Chapel Hill, Chapel Hill, North Carolina, USA.
4Department of Medicine, Vanderbilt University Medical Center, Nashville, Tennessee, USA.
Address correspondence to: Brent A. Hanks, Lineberger Comprehensive Cancer Center, University of North Carolina, 450 West Drive, CB# 7295, Chapel Hill, North Carolina 27599, USA. Email: Brent_Hanks@med.unc.edu.
Find articles by Plebanek, M. in: PubMed | Google Scholar
1Lineberger Comprehensive Cancer Center, Department of Medicine, Division of Medical Oncology, Department of Microbiology and Immunology, UNC School of Medicine, University of North Carolina at Chapel Hill, Chapel Hill, North Carolina, USA.
2Duke Cancer Institute, Department of Medicine, Division of Medical Oncology, Duke University, Durham, North Carolina, USA.
3Department of Pharmacology, UNC School of Medicine, University of North Carolina at Chapel Hill, Chapel Hill, North Carolina, USA.
4Department of Medicine, Vanderbilt University Medical Center, Nashville, Tennessee, USA.
Address correspondence to: Brent A. Hanks, Lineberger Comprehensive Cancer Center, University of North Carolina, 450 West Drive, CB# 7295, Chapel Hill, North Carolina 27599, USA. Email: Brent_Hanks@med.unc.edu.
Find articles by Holtzhausen, A. in: PubMed | Google Scholar
1Lineberger Comprehensive Cancer Center, Department of Medicine, Division of Medical Oncology, Department of Microbiology and Immunology, UNC School of Medicine, University of North Carolina at Chapel Hill, Chapel Hill, North Carolina, USA.
2Duke Cancer Institute, Department of Medicine, Division of Medical Oncology, Duke University, Durham, North Carolina, USA.
3Department of Pharmacology, UNC School of Medicine, University of North Carolina at Chapel Hill, Chapel Hill, North Carolina, USA.
4Department of Medicine, Vanderbilt University Medical Center, Nashville, Tennessee, USA.
Address correspondence to: Brent A. Hanks, Lineberger Comprehensive Cancer Center, University of North Carolina, 450 West Drive, CB# 7295, Chapel Hill, North Carolina 27599, USA. Email: Brent_Hanks@med.unc.edu.
Find articles by Bolch, E. in: PubMed | Google Scholar
1Lineberger Comprehensive Cancer Center, Department of Medicine, Division of Medical Oncology, Department of Microbiology and Immunology, UNC School of Medicine, University of North Carolina at Chapel Hill, Chapel Hill, North Carolina, USA.
2Duke Cancer Institute, Department of Medicine, Division of Medical Oncology, Duke University, Durham, North Carolina, USA.
3Department of Pharmacology, UNC School of Medicine, University of North Carolina at Chapel Hill, Chapel Hill, North Carolina, USA.
4Department of Medicine, Vanderbilt University Medical Center, Nashville, Tennessee, USA.
Address correspondence to: Brent A. Hanks, Lineberger Comprehensive Cancer Center, University of North Carolina, 450 West Drive, CB# 7295, Chapel Hill, North Carolina 27599, USA. Email: Brent_Hanks@med.unc.edu.
Find articles by Johnson, D. in: PubMed | Google Scholar
1Lineberger Comprehensive Cancer Center, Department of Medicine, Division of Medical Oncology, Department of Microbiology and Immunology, UNC School of Medicine, University of North Carolina at Chapel Hill, Chapel Hill, North Carolina, USA.
2Duke Cancer Institute, Department of Medicine, Division of Medical Oncology, Duke University, Durham, North Carolina, USA.
3Department of Pharmacology, UNC School of Medicine, University of North Carolina at Chapel Hill, Chapel Hill, North Carolina, USA.
4Department of Medicine, Vanderbilt University Medical Center, Nashville, Tennessee, USA.
Address correspondence to: Brent A. Hanks, Lineberger Comprehensive Cancer Center, University of North Carolina, 450 West Drive, CB# 7295, Chapel Hill, North Carolina 27599, USA. Email: Brent_Hanks@med.unc.edu.
Find articles by Uronis, H. in: PubMed | Google Scholar
1Lineberger Comprehensive Cancer Center, Department of Medicine, Division of Medical Oncology, Department of Microbiology and Immunology, UNC School of Medicine, University of North Carolina at Chapel Hill, Chapel Hill, North Carolina, USA.
2Duke Cancer Institute, Department of Medicine, Division of Medical Oncology, Duke University, Durham, North Carolina, USA.
3Department of Pharmacology, UNC School of Medicine, University of North Carolina at Chapel Hill, Chapel Hill, North Carolina, USA.
4Department of Medicine, Vanderbilt University Medical Center, Nashville, Tennessee, USA.
Address correspondence to: Brent A. Hanks, Lineberger Comprehensive Cancer Center, University of North Carolina, 450 West Drive, CB# 7295, Chapel Hill, North Carolina 27599, USA. Email: Brent_Hanks@med.unc.edu.
Find articles by Strickler, J. in: PubMed | Google Scholar
1Lineberger Comprehensive Cancer Center, Department of Medicine, Division of Medical Oncology, Department of Microbiology and Immunology, UNC School of Medicine, University of North Carolina at Chapel Hill, Chapel Hill, North Carolina, USA.
2Duke Cancer Institute, Department of Medicine, Division of Medical Oncology, Duke University, Durham, North Carolina, USA.
3Department of Pharmacology, UNC School of Medicine, University of North Carolina at Chapel Hill, Chapel Hill, North Carolina, USA.
4Department of Medicine, Vanderbilt University Medical Center, Nashville, Tennessee, USA.
Address correspondence to: Brent A. Hanks, Lineberger Comprehensive Cancer Center, University of North Carolina, 450 West Drive, CB# 7295, Chapel Hill, North Carolina 27599, USA. Email: Brent_Hanks@med.unc.edu.
Find articles by DeVito, N. in: PubMed | Google Scholar
1Lineberger Comprehensive Cancer Center, Department of Medicine, Division of Medical Oncology, Department of Microbiology and Immunology, UNC School of Medicine, University of North Carolina at Chapel Hill, Chapel Hill, North Carolina, USA.
2Duke Cancer Institute, Department of Medicine, Division of Medical Oncology, Duke University, Durham, North Carolina, USA.
3Department of Pharmacology, UNC School of Medicine, University of North Carolina at Chapel Hill, Chapel Hill, North Carolina, USA.
4Department of Medicine, Vanderbilt University Medical Center, Nashville, Tennessee, USA.
Address correspondence to: Brent A. Hanks, Lineberger Comprehensive Cancer Center, University of North Carolina, 450 West Drive, CB# 7295, Chapel Hill, North Carolina 27599, USA. Email: Brent_Hanks@med.unc.edu.
Find articles by
Hanks, B.
in:
PubMed
|
Google Scholar
|

Published August 13, 2026 - More info
J Clin Invest. 2026;136(20):e201816. https://doi.org/10.1172/JCI201816.
© 2026 Theivanthiran et al. This work is licensed under the Creative Commons Attribution 4.0 International License. To view a copy of this license, visit http://creativecommons.org/licenses/by/4.0/.
Received: October 28, 2025; Accepted: August 11, 2026


-
Results
Tumor-intrinsic NLRP3 inflammasome activity and tumor NLRP3 amplification are associated with anti–PD-1 resistance in patients with advanced melanoma. Using an NLRP3-ASC proximity ligation assay (PLA) as a surrogate marker for NLRP3 inflammasome activity, we have previously shown that elevated baseline tumor-intrinsic NLRP3 signaling activity correlates with resistance to checkpoint inhibitor immunotherapy in previously untreated patients with stage IV melanoma (5). To verify these findings, we examined baseline tumor tissue specimens harvested from an independent cohort of patients with naive stage IV melanoma treated at an outside institution using the same NLRP3-ASC PLA (Figure 1A and Supplemental Table 1; supplemental material available online with this article; https://doi.org/10.1172/JCI201816DS1). This work supported our previous findings, demonstrating that elevated baseline tumor NLRP3 signaling activity correlates with resistance in patients who have received either anti–PD-1 monotherapy or combination anti–PD-1/anti–cytotoxic T lymphocyte antigen 4 (anti–CTLA-4) therapy. Indeed, multivariate analysis of our cumulative patient cohort shows that elevated baseline tumor NLRP3 signaling activity is associated with diminished progression-free survival (PFS) in patients with naive stage IV melanoma undergoing checkpoint inhibitor immunotherapy (HR 0.013, 95% CI: 0.03–0.69, P = 0.02) (Figure 1B and Supplemental Tables 1 and 2).
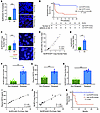 Figure 1
Elevated tumor-intrinsic NLRP3 activity and NLRP3 amplification correlate with anti–PD-1 resistance in multiple cohorts of patients with advanced melanoma. (A) Tumor NLRP3 inflammasome activity levels measured based on NLRP3-ASC proximity ligation assays (PLAs) in responder (R) and nonresponder (NR) patients with stage IV melanoma treated with anti–PD-1 monotherapy. Quantified as dots per high-power field (hpf). Original magnification, 40×. Right, representative PLA images in R and NR patients. Scale bar = 10 μm. Vanderbilt patient cohort. (B) Progression-free survival (PFS) of patients with naive stage IV melanoma treated with anti–PD-1 monotherapy stratified based on baseline NLRP3-ASC PLA scores below and above the median. Multivariate analysis performed using the Cox proportional hazards model. (C) Baseline tumor NLRP3/CEP1 copy number ratios based on FISH in R and NR patients with stage IV melanoma undergoing anti–PD-1 monotherapy. Right, representative FISH images in R and NR patients. Original magnification, 100×. Scale bar = 5 μm. Duke patient cohort. CEP1, chromosome enumeration probe 1. (D) Spearman’s correlation analysis between NLRP3 activity levels based on NLRP3-ASC PLAs and NLRP3 copy number based on FISH in stage IV melanoma tissues. (E) Tumor NLRP3/CEP1 copy number ratios based on FISH in R and NR patients with stage IV melanoma. Vanderbilt patient cohort. (F) Baseline tumor NLRP3 inflammasome activity levels measured based on NLRP3-ASC PLAs in nonrelapsed and relapsed patients with stage III melanoma treated with adjuvant anti–PD-1 immunotherapy. (G) Plasma HSP70 levels based on ELISA in nonrelapsed and relapsed patients with stage III melanoma treated with adjuvant anti–PD-1 immunotherapy. (H) Tumor NLRP3/CEP1 copy number ratios in nonrelapsed and relapsed patients with stage III melanoma treated with adjuvant anti–PD-1 immunotherapy. (I and J) Spearman’s correlation analysis between NLRP3 activity levels based on NLRP3-ASC PLAs and HSP70 plasma levels based on ELISA (I) and NLRP3-ASC PLAs and NLRP3 copy number based on FISH (J) in stage III melanoma tissues. (K) Recurrence-free survival (RFS) of patients with stage III melanoma treated with adjuvant anti–PD-1 immunotherapy stratified based on baseline NLRP3-ASC PLA scores below and above the median. Statistical analysis performed by log-rank test. A, C, and E–H: statistical analysis performed using unpaired t tests. Data expressed as mean values ± SEM. **P < 0.005, ***P < 0.0005.
We reasoned that an underlying genetic mechanism was likely determining whether a tumor could leverage the NLRP3 inflammasome pathway to evade antitumor immunity. Prior studies have noted that NLRP3 genetic amplification occurs in several solid tumors (7). Indeed, approximately 16% of cutaneous melanomas, including a combination of both early- and late-stage disease in The Cancer Genome Atlas (TCGA), harbor amplified NLRP3 (6, 15). Based on these data, we performed an NLRP3 fluorescence in situ hybridization (FISH) assay on baseline tumor tissue specimens derived from patients with stage IV melanoma initiating either anti–PD-1 monotherapy or combination anti–PD-1/anti–CTLA-4. This analysis found copy number gains of NLRP3 in 48% of these patients and an association of this marker with resistance to first-line checkpoint inhibitor immunotherapy (Figure 1C and Supplemental Table 1). Indeed, NLRP3 gene copy number was found to correlate closely with NLRP3 signaling activity in melanoma tissues, suggesting that copy number gain is the primary genetic mechanism influencing tumor NLRP3 signaling activity (Figure 1D). We further validated these findings by performing NLRP3 FISH assays on baseline tissue specimens derived from an independent cohort of patients with stage IV melanoma receiving checkpoint inhibitor immunotherapy (Figure 1E). Overall, this work suggests that somatic copy number gains of NLRP3 by melanoma tissues influence tumor NLRP3 signaling activity and promote resistance to checkpoint inhibitor immunotherapy.
There is currently a substantial need for predictive biomarkers for treating patients with stage III melanoma, as many of these patients derive no clinical benefit from adjuvant checkpoint inhibitor immunotherapy yet are being placed at risk for developing immune-related adverse events. As a result, we conducted NLRP3-ASC PLA and NLRP3 FISH assays on baseline tumor specimens along with an HSP70 enzyme-linked immunosorbent assay (ELISA) on baseline plasma specimens derived from patients with stage III melanoma before initiating adjuvant anti–PD-1 immunotherapy. These studies demonstrated elevated tumor NLRP3 signaling activity, increased baseline plasma levels of HSP70, and tumor NLRP3 amplification to be associated with anti–PD-1 failure and melanoma recurrence (Figure 1, F–H, and Supplemental Table 3). Again, we found baseline plasma HSP70 levels to correlate closely with tumor NLRP3 activity levels and, in turn, with NLRP3 amplification levels in this cohort of stage III melanoma (Figure 1, I and J). Consistent with these findings, stage III melanoma patients with tumor NLRP3 activity levels above the median associated with inferior recurrence-free survival relative to those harboring melanomas with NLRP3 activity below the median (P = 0.025) (Figure 1K). These cumulative data suggest that tumor-intrinsic NLRP3 signaling activity contributes to immune evasion and checkpoint inhibitor immunotherapy resistance in melanoma (5, 6).
An NLRP3 transcriptional signature correlates with resistance to anti–PD-1 immunotherapy in patients with advanced melanoma. To examine the relationship between activation of the tumor-intrinsic NLRP3 inflammasome and immunotherapy resistance in a larger number of patients with melanoma in publicly available clinical datasets, we constructed an unbiased transcriptional signature of NLRP3 activation in melanoma tissues by utilizing a genetically engineered murine model of melanoma (Figure 2A). This included capturing upregulated genes in BRAFV600E PTEN–/– melanomas modified via CRISPRa to exhibit enhanced Nlrp3 transcriptional activity (BRAFV600E PTEN–/– NLRP3a) and integrating this gene set with the downregulated genes in a newly generated transgenic Tyr-cre BRAFV600E PTENfl/fl NLRP3fl/fl tumor model exhibiting melanoma-restricted ablation of Nlrp3 (Figure 2B). Melanoma tissue-restricted knockout of Nlrp3 expression was first confirmed, and diminished expression of genes known to play a role in PMN recruitment was also verified in BRAFV600E PTEN–/– NLRP3–/– tumors (Supplemental Figure 1, A and B). This was followed by flow cytometry verification of a reduction in PMN-MDSC recruitment by BRAFV600E PTEN–/– NLRP3–/– melanomas versus control BRAFV600E PTEN–/– melanomas (Supplemental Figure 1C). In line with our previous data, we found BRAFV600E PTEN–/– NLRP3–/– tumor growth to be suppressed relative to control BRAFV600E PTEN–/– tumors (Figure 2B). By combining these models, we generated a 48-gene transcriptional profile reflecting tumor-intrinsic NLRP3 activation and found this NLRP3-tsig to positively correlate with a PMN-MDSC transcriptional signature in melanoma tissues using single-sample gene set enrichment analysis (ssGSEA) (Figure 2C and Supplemental Table 4). We then performed receiver-operator characteristic (ROC) curve analyses of NLRP3-tsig applied to independent previously reported datasets of patients with stage IV melanoma treated with anti–PD-1 immunotherapy (16). This work showed the NLRP3 signature to predict resistance to anti–PD-1 immunotherapy with an area under the curve (AUC) value of 0.724 in the Hugo et al. dataset (26 patients) and an AUC value of 0.679 in the Gide et al. dataset (29 patients) (Figure 2D) (16, 17). Indeed, the NLRP3-tsig signature outperformed both the PMN-MDSC signature and a monocytic MDSC (M-MDSC) signature in predicting response to anti–PD-1 immunotherapy in melanoma (Figure 2E) (18). Importantly, the NLRP3-tsig signature also performed favorably compared with previously reported signatures in predicting anti–PD-1 resistance in patients with advanced melanoma, including the ICBresistance, X18signature, TIDE, IMPRES, and IPRES signatures, in the Hugo et al. dataset, as well as the larger Lee et al. dataset (43 patients) (Figure 2, F and G) (16, 19–22). We further found this NLRP3-associated transcriptional signature to be superior in predicting resistance relative to a previously developed NLRP3pancancersig signature constructed from various components of the NLRP3 signaling pathway in both of these datasets (Figure 2, F and G) (23). Finally, our studies indicate that the elevated NLRP3-tsig also correlates with a diminished disease-free survival in TCGA melanoma dataset (Figure 2H). Our cumulative data suggest that the tumor-intrinsic NLRP3 signaling pathway represents a promising source of biomarkers for predicting poor outcomes in patients with advanced melanoma undergoing checkpoint inhibitor immunotherapy.
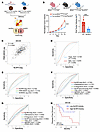 Figure 2
Tumor NLRP3 inflammasome transcriptional signature predicts for anti–PD-1 resistance in multiple cohorts of patients with stage IV melanoma. (A) Schematic describing the generation of a tumor NLRP3 transcriptional signature (NLRP3-tsig). BRAFV600E PTEN–/–NLRP3a cell line was generated using a CRISPR activation (CRISPRa) protocol and implanted into syngeneic mice by subcutaneous injection. The Tyr-cre BRAFV600E PTEN–/– NLRP3fl/fl tumor model is a transgenic melanoma model with melanoma tissue–restricted silencing of Nlrp3. Each of these tumor models were resected for RNA-seq. Generated using BioRender. NLRP3a, Nlrp3 amplification. (B) Top, schematic illustrating the generation of the melanoma-specific Nlrp3–/– transgenic mouse model: Tyr-cre BRAFV600E PTENfl/fl NLRP3fl/fl (NLRP3–/–). Generated using BioRender. Bottom left, induced primary melanoma progression in the NLRP3–/– and ctrl transgenic melanoma mouse strains. Bottom right, end tumor volumes in the NLRP3–/– and ctrl transgenic melanoma models. Statistical analysis performed using unpaired t tests. (C) Single-sample gene set enrichment analysis (ssGSEA) shows a PMN-MDSC transcriptional signature (PMN-MDSC-sig) correlates with NLRP3-tsig in the melanoma (SKCM) TCGA. (D) Receiver operating characteristic (ROC) curve analysis of the NLRP3-tsig signature in the Hugo et al. and Gide et al. datasets of patients with stage IV melanoma treated with anti–PD-1 immunotherapy. AUC, area under the curve. (E) ROC curve analysis comparing the NLRP3-tsig signature with PMN-MDSC-sig and M-MDSC-sig transcriptional signatures in the Hugo et al. dataset. (F) ROC curve analysis comparing the NLRP3-tsig signature with previously published transcriptional signatures in the Hugo et al. dataset. (G) ROC curve analysis comparing the NLRP3-tsig signature with previously published anti–PD-1 resistance transcriptional signatures in the Lee et al. dataset of patients with stage IV melanoma treated with anti–PD-1 immunotherapy. (H) Gene Expression Profiling Interactive Analysis (GEPIA) utilized to analyze the disease-free survival of patients with melanoma in TCGA (SKCM) based on the NLRP3-tsig transcriptional signature (high, above the median; low, below the median). Statistical analysis performed by log-rank test. ***P < 0.0005.
Tumor-intrinsic NLRP3 signaling activity suppresses tumor NLRC5 and MHC class I expression levels. As NLRP3 amplification correlates with anti–PD-1 immunotherapy resistance in patients with melanoma as well as in the BRAFV600E PTEN–/– melanoma model, we investigated whether tumor-intrinsic NLRP3 signaling triggers additional mechanisms to evade antitumor immunity. We therefore expanded our analysis of the transcriptional alterations induced by Nlrp3 amplification using the previously engineered murine BRAFV600E PTEN–/– NLRP3a melanoma cell line (6). This work revealed a downregulation in the expression of genes associated with antigen processing and presentation relative to control BRAFV600E PTEN–/– NTC tumors (Figure 3A). While Western blot studies showed IFN-γ stimulation enhanced expression levels of the MHC class I transactivator, NLRC5, in a control BRAFV600E PTEN–/– melanoma cell line (BRAFV600E PTEN–/– NTC), this increase was suppressed in the BRAFV600E PTEN–/– NLRP3a melanoma cell line (Figure 3B). Consistent with these findings, we also found that a small molecule inhibitor of the NLRP3 inflammasome, MCC950, enhanced NLRC5 expression levels in both murine and human melanoma cell lines, as well as a pancreatic ductal adenocarcinoma cell line, indicating this effect also occurs in nonmelanoma tumors (Figure 3C and Supplemental Figure 2, A and B) (24). To determine whether corresponding alterations in MHC class I surface expression are observed in response to NLRP3 signaling activity, we performed pan-MHC class I flow cytometry analysis of BRAFV600E PTEN–/– NLRP3a and BRAFV600E PTEN–/– NTC melanomas following their surgical resection and observed a marked diminishment in MHC class I surface expression in Nlrp3-amplified melanomas (Figure 3D). Indeed, pharmacologic inhibition of NLRP3 in BRAFV600E PTEN–/– melanomas in vivo and a pancreatic ductal adenocarcinoma cell line in vitro correspondingly resulted in enhanced levels of MHC class I surface expression (Figure 3D and Supplemental Figure 2C). We have previously demonstrated that the tumor-intrinsic NLRP3 inflammasome pathway triggers the recruitment of PMN-MDSCs into the TME, and others have reported a link between tumor-infiltrating PMN-MDSCs and MHC class I downregulation (25). However, we found no evidence that PMN-MDSC ablation enhances tumor MHC class I expression levels in the transgenic BRAFV600E PTEN–/– melanoma model (Supplemental Figure 2D).
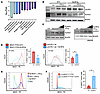 Figure 3
Genetic and pharmacologic inhibition of NLRP3 in tumors enhances NLRC5 and MHC class I expression levels. (A) Most downregulated pathways in the Nlrp3-amplified BRAFV600E PTEN–/– melanoma cell line (BRAFV600E PTEN–/– NLRP3a) versus the parental BRAFV600E PTEN–/– melanoma cell line based on KEGG pathway analysis of RNA-seq data (n = 2). KEGG, Kyoto Encyclopedia of Genes and Genomes. (B) NLRP3 and NLRC5 Western blot analysis of the BRAFV600E PTEN–/– NTC and BRAFV600E PTEN–/– NLRP3a melanoma cell lines following PBS versus IFN-γ treatment. NTC, nontarget control (n = 3). (C) Left, NLRC5 Western blot analysis of the BRAFV600E PTEN–/– melanoma cell line following PBS or IFN-γ treatment with increasing concentrations of the NLRP3 inhibitor (NLRP3i), MCC950 (n = 3). Right, NLRC5 Western blot analysis of the human WM266 melanoma cell line following PBS or IFN-γ treatment with increasing concentrations of the NLRP3 inhibitor, MCC950 (n = 3). (D) Left, pan-MHC class I flow cytometry analysis of resected in situ BRAFV600E PTEN–/– NTC and BRAFV600E PTEN–/– NLRP3a melanomas. Right, pan-MHC class I flow cytometry analysis of resected in situ BRAFV600E PTEN–/– NTC melanomas following treatment with anti–PD-1 ab versus anti–PD-1 + MCC950. ab, antibody (n = 3). (E) pan-MHC class I flow cytometry analysis of BRAFV600E PTEN–/– NTC versus Nlrp3-knockdown (KD) BRAFV600E PTEN–/– NLRP3KD cell line following PBS versus IFN-γ treatment (n = 3). (F) Left, flow cytometry analysis of pan-MHC class I expression levels of resected primary melanomas in the NLRP3–/– and ctrl transgenic melanoma mouse strains. Right, percentage MHC class I–positive tumor cells in the NLRP3–/– and ctrl transgenic melanoma mouse strains (n = 3). D and F: statistical analysis performed using unpaired t test. Data expressed as mean values ± SEM. *P < 0.05.
We have previously shown that PD-L1 triggers activation of the NLRP3 inflammasome signaling pathway in tumors (5). As a result, we performed Western blot studies in Cd274-silenced BRAFV600E PTEN–/– melanoma cell lines (BRAFV600E PTEN–/– PDL1KD) and noted an increase in NLRC5 expression levels, a finding that was phenocopied by an Nlrp3-silenced BRAFV600E PTEN–/– melanoma cell line (Supplemental Figure 2E). These findings were consistent with an observed increase in surface MHC class I in response to IFN-γ stimulation in both BRAFV600E PTEN–/– NLRP3KD and BRAFV600E PTEN–/– PDL1KD tumor cell lines (Figure 3E and Supplemental Figure 2F).
In order to examine this pathway more rigorously in vivo, we turned to the autochthonous melanoma model genetically silenced for melanocyte-specific Nlrp3 expression (Tyr-cre BRAFV600E PTENfl/fl NLRP3fl/fl) described above (Figure 2B). Flow cytometry analysis of the resected melanoma tissues revealed an increase in MHC class I surface expression in BRAFV600E PTEN–/– NLRP3–/– tumors in situ compared with control BRAFV600E PTEN–/– tumors (Figure 3F). Together, this work describes a potentially previously unrecognized role for the NLRP3 inflammasome in suppressing NLRC5 and the MHC class I antigen processing and presentation machinery of tumors.
Tumor-intrinsic NLRP3 inflammasome inhibits NLRC5 expression by blocking STAT1-mediated transcription. We initially hypothesized that the tumor-intrinsic NLRP3 pathway may be eliciting the upregulation of a soluble factor that suppresses NLRC5-MHC class I tumor expression, prompting experiments demonstrating that the conditioned medium of Nlrp3-amplified BRAFV600E PTEN–/– melanoma cells modestly suppresses IFN-γ–dependent induction of NLRC5 and MHC class I expression (Supplemental Figure 3, A and B). Since soluble HSP70 is released downstream of tumor-intrinsic NLRP3 activation, we also compared NLRC5-MHC class I expression between BRAFV600E PTEN–/– HSP70–/– versus BRAFV600E PTEN–/– NTC control cells and found NLRC5 expression to be moderately elevated in HSP70-ablated tumor cells (Supplemental Figure 3C). Indeed, there was a slight increase in MHC class I surface levels in HSP70-silenced BRAFV600E PTEN–/– melanoma cells, as well as BRAFV600E PTEN–/– melanoma cells treated with an anti-HSP70 antagonistic antibody (Supplemental Figure 3D). However, given the modest overall changes in tumor NLRC5-MHC class I expression observed, we initiated studies to explore other pathways that may be regulated more directly by NLRP3. Therefore, we immunoprecipitated NLRP3 from BRAFV600E PTEN–/– melanoma cells following NLRP3 activation via IFN-γ/anti–PD-L1 ab treatment and analyzed these products by tandem mass spectrometry versus untreated BRAFV600E PTEN–/– melanoma cells. Of the 27 unique proteins found to bind to NLRP3 upon IFN-γ/anti–PD-L1 ab activation in tumor cells, STAT1 was determined to be the most abundant (Figure 4A, Supplemental Figure 4A, and Supplemental Table 5). Since NLRC5 is transcriptionally regulated by STAT1, we conducted a series of co-immunoprecipitation experiments to confirm NLRP3-STAT1 binding in the BRAFV600E PTEN–/– melanoma cell line (Figure 4B). We noted that IFN-γ/anti–PD-L1 ab treatment of BRAFV600E PTEN–/– melanoma cells suppressed phosphorylated STAT1 levels, an effect that was enhanced with NLRP3-FLAG expression (Figure 4C). Indeed, time course studies showed NLRP3-FLAG expression more rapidly suppressed both total and phosphorylated levels of STAT1 in BRAFV600E PTEN–/– melanoma cells (Figure 4D). Based on these findings, we looked for and found no evidence that NLRP3-STAT1 binding promotes STAT1 proteasomal degradation (Supplemental Figure 4B). However, additional Western blot studies following nuclear-cytoplasmic fractionation showed NLRP3-FLAG expression nearly eliminated total STAT1 levels in the nucleus (Figure 4E). As a result, we conducted native non-denaturing Western blots and found NLRP3 suppressed STAT1 dimerization, a process necessary for STAT1 nuclear translocation (Figure 4F) (26). Consistent with these findings, we used a luciferase reporter system to further demonstrate that NLRP3 inhibits STAT1-dependent transcriptional activity (Figure 4G). As STAT1 is known to autoregulate its own transcription, we further confirmed a downregulation of STAT1 and other MHC class I transcript levels in both BRAFV600E PTEN–/– melanoma cells and BRAFV600E PTEN–/– melanoma tissues harboring amplified Nlrp3 (Figure 4H). Notably, we also determined NLRP3 activation similarly suppressed STAT1 phosphorylation and Nlrc5 expression in primary bone marrow–derived dendritic cells, suggesting that NLRP3-mediated inhibition of STAT1 and NLRC5 is not restricted to tumors (Supplemental Figure 4, C and D). Finally, we found NLRP3 upregulation to have no impact on tumor cell IFN-γ receptor surface levels or for caspase-1 activity to influence NLRC5 expression (Supplemental Figure 4, E and F).
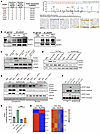 Figure 4
NLRP3 binds to STAT1, inhibits STAT1 dimerization, and suppresses STAT1-dependent transcriptional activation of NLRC5. (A) Tandem mass spectrometry identified STAT1 as the most abundant NLRP3-associated protein in tumor cells following IFN-γ + anti–PD-L1 ab treatment (n = 2). (B) Left, NLRP3 and STAT1 Western blot analysis following STAT1 versus IgG ctrl immunoprecipitation (IP) of BRAFV600E PTEN–/– melanoma cells treated with PBS, IFN-γ, or IFN-γ + anti–PD-L1 ab (n = 3). Right, STAT1 and NLRP3 Western blot analysis following NLRP3 versus IgG ctrl IP of BRAFV600E PTEN–/– melanoma cells treated with PBS, IFN-γ, or IFN-γ + anti–PD-L1 ab (n = 3). (C) NLRC5, phosphorylated STAT1 (Tyr701) (p-STAT1), and total STAT1 (t-STAT1) Western blot analysis of ctrl BRAFV600E PTEN–/– melanoma cells versus NLRP3-FLAG-expressing BRAFV600E PTEN–/– melanoma cells treated with PBS, IFN-γ, or IFN-γ + anti–PD-L1 ab (n = 3). (D) p-STAT1 and t-STAT1 Western blot analysis of control BRAFV600E PTEN–/– melanoma cells and NLRP3-FLAG-expressing BRAFV600E PTEN–/– melanoma cells following IFN-γ stimulation at various time points (n = 3). (E) p-STAT1 and t-STAT1 Western blot analysis of cytoplasmic and nuclear lysates isolated from ctrl BRAFV600E PTEN–/– melanoma cells or NLRP3-FLAG-expressing BRAFV600E PTEN–/– melanoma cells treated with PBS, IFN-γ, or IFN-γ + anti–PD-L1 ab (n = 3). (F) Non-denaturing p-STAT1 and t-STAT1 Western blot analysis of ctrl BRAFV600E PTEN–/– melanoma cells or NLRP3-FLAG-expressing BRAFV600E PTEN–/– melanoma cells treated with PBS or IFN-γ for 1 hour or 2 hours (n = 3). (G) STAT1 luciferase reporter activity in ctrl BRAFV600E PTEN–/– melanoma cells or NLRP3-FLAG-expressing BRAFV600E PTEN–/– melanoma cells treated with either PBS or IFN-γ (n = 3). RLU, relative light units. Statistical analysis based on a 2-way ANOVA followed by Tukey’s multiple comparison test. (H) Left, RNA-seq analysis of ctrl BRAFV600E PTEN–/– and BRAFV600E PTEN–/– NLRP3a melanoma cells. Right, RNA-seq analysis of FACS-sorted CD90.2–CD31–CD45– ctrl BRAFV600E PTEN–/– and BRAFV600E PTEN–/– NLRP3a melanoma tumor cells (n = 2). All data expressed as mean values ± SEM. ***P < 0.0005.
In summary, this work suggests that the NLRP3 inflammasome complexes with STAT1, thereby inhibiting STAT1 dimerization and nuclear translocation. This process suppresses STAT1-dependent transcription of NLRC5 and appears to be the most dominant mechanism inhibiting downstream expression of MHC class I–associated genes in tumor cells.
NLRP3 inhibition reverses STAT1-NLRC5-MHC class I suppression and enhances response to anti–PD-1 immunotherapy in an orthotopic model of gastric adenocarcinoma. A review of TCGA has revealed that several other solid tumor malignancies, including GE adenocarcinoma, also exhibit NLRP3 amplification (6). As a result, we conducted a series of studies in a murine model of chromosomal instability (CIN) gastric adenocarcinoma derived from a recently engineered Anxa10-CreERT2 KrasG12D/+ Tp53R172H/+ Smad4fl/fl transgenic mouse model (KPS) (Supplemental Figure 5A) (27). Similar to our previous studies, we confirmed IFN-γ/anti–PD-L1 treatment to induce NLRP3 and caspase-1 activation and for this to be associated with enhanced HSP70 release and suppressed NLRC5 expression in the CIN KPS gastric cancer cell line in vitro (Supplemental Figure 5, B–D). After demonstrating that NLRP3 activation also suppresses STAT1 signaling in the CIN KPS gastric cancer model, we confirmed that inhibition of the NLRP3 inflammasome augments nuclear phosphorylated STAT1 levels both in vitro and in CIN KPS gastric tumors in vivo (Figure 5A and Supplemental Figure 6, A–C). In line with these findings, we found NLRP3 inhibition with MCC950 increased levels of NLRC5 and MHC class I expression in vitro (Supplemental Figure 6, D and E). Importantly, we also confirmed increased MHC class I expression by in situ tumor tissues following treatment with an NLRP3 inhibitor (Figure 5, B and C). These observations prompted us to explore whether an NLRP3 inhibitor may overcome resistance to anti–PD-1 immunotherapy in a syngeneic subcutaneous CIN KPS gastric cancer model. This study demonstrated NLRP3 inhibitor therapy alone and in combination with anti–PD-1 to suppress tumor progression more effectively than anti–PD-1 monotherapy (Supplemental Figure 6F). Flow cytometry analysis of these resected tumors showed this effect correlated with diminished PMN-MDSC recruitment and enhanced levels of CD8+ T cell infiltration (Supplemental Figure 6G). To evaluate the impact of an NLRP3 inhibitor in a more rigorous model of GE adenocarcinoma, we evaluated NLRP3 inhibitor/anti–PD-1 combination therapy in murine hosts harboring orthotopic CIN KPS gastric cancers (Figure 5D). These tumors were allowed to progress for 8 days followed by treatment on 3 arms: (a) anti–PD-1 immunotherapy every 3 days alone, (b) NLRP3 inhibitor dosed every other day alone, and (c) combination treatment (Figure 5E). This study demonstrated NLRP3 inhibitor/anti–PD-1 immunotherapy enhanced the survival of mice harboring orthotopic KPS gastric tumors versus those mice receiving either agent alone (Figure 5F). Indeed, NLRP3 inhibitor/anti–PD-1 combination therapy suppressed KPS gastric tumor progression based on gastric tumor weight measurements (Supplemental Figure 6H). In order to continuously monitor these orthotopic tumors during the treatment, we utilized an In Vivo Imaging System (IVIS) platform to track tandem-dimer Tomato–expressing (tdTomato-expressing) CIN KPS gastric tumors implanted into the gastric lining of syngeneic mice (Figure 5D). Consistent with our prior data, the addition of an NLRP3 inhibitor suppressed primary CIN gastric tumor growth while anti–PD-1 immunotherapy alone had only a modest suppressive effect (Figure 5, G and H). This study further showed anti–PD-1 immunotherapy enhanced tumor-intrinsic NLRP3 signaling activity and HSP70 release into the plasma, effects that were reversed with the NLRP3 inhibitor, MCC950 (Figure 5I) (5, 6). Based on both flow cytometry and IHC, we further found NLRP3 inhibition to suppress PMN-MDSC accumulation while enhancing CD8+ T cell infiltration into these orthotopic CIN gastric tumors (Figure 5J and Supplemental Figure 6, I and J). Also consistent with these findings, an Nlrp3-amplified CIN KPS gastric cancer cell line was engineered and verified to exhibit diminished STAT1 phosphorylation and MHC class I expression in response to IFN-γ (Supplemental Figure 6K). Indeed, additional orthotopic tumor studies demonstrated Nlrp3-amplified CIN KPS gastric tumors progressed more rapidly than control CIN KPS gastric tumors and to be associated with inferior survival, lower MHC class I surface expression, enhanced levels of PMN-MDSCs, and suppressed CD8+ T cell tumor infiltration (Supplemental Figure 6, L–O).
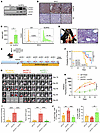 Figure 5
Inhibiting NLRP3 overcomes resistance to anti–PD-1 Immunotherapy in an orthotopic model of CIN gastric adenocarcinoma. (A) p-STAT1 and t-STAT1 Western blot of whole tumor tissue lysate following treatment of orthotopic KPS CIN gastric tumors with vehicle control (ctrl) versus MCC950 (NLRP3i) (n = 3). (B) Pan-MHC class I IHC analysis of tumor tissues derived from orthotopic KPS CIN gastric tumors following treatment with either NLRP3i versus vehicle ctrl (n = 3). Representative images shown. Scale bar = 20 μm. (C) Pan-MHC class I flow cytometry analysis of FACS-sorted CD90.2–CD31–CD45– ctrl tumor cells following treatment of orthotopic KPS CIN gastric tumors with either NLRP3i versus vehicle ctrl. Left, representative pan-MHC class I flow histograms. Statistical analysis based on unpaired t test (n = 3). (D) Gross image of an orthotopic KPS CIN gastric tumor. Red arrow, implanted tumor cells in the gastric mucosa. Right, representative H&E microscopy of an orthotopic KPS CIN gastric tumor. Scale bar = 50 μm. (E) Schematic describing the anti–PD-1/NLRP3i treatment schedule for the orthotopic KPS CIN gastric cancer model. (F) Survival analysis of mice harboring orthotopic KPS CIN gastric tumors following treatment with IgG isotype control, anti–PD-1 alone, NLRP3i alone, versus combination anti–PD-1/NLRP3i (n = 10 mice/group). Statistical analysis based on log-rank test. (G) IVIS monitoring of orthotopic tdTomato-expressing KPS gastric tumors in syngeneic mice while undergoing IgG isotype control, anti–PD-1 alone, versus combination anti–PD-1/NLRP3i therapy. (H) IVIS quantification of tdTomato-expressing KPS gastric tumors while undergoing IgG isotype control, anti–PD-1 alone, versus combination anti–PD-1/NLRP3i therapy over time (n = 8 mice/group). (I) Left, NLRP3-ASC PLA of orthotopic KPS CIN gastric tumors following treatment with IgG isotype ctrl, anti–PD-1 ab, and anti–PD-1/NLRP3i. Right, plasma HSP70 ELISA performed on day 25 following treatment with IgG isotype ctrl, anti–PD-1 ab, and anti–PD-1/NLRP3i (n = 5 mice/group). (J) Left, flow cytometry analysis of tumor-infiltrating CD11b+Ly6G+F4/80– PMN-MDSCs following treatment with IgG isotype ctrl, anti–PD-1 ab, and anti–PD-1/NLRP3i. Right, flow cytometry analysis of tumor-infiltrating CD8+ T cells following treatment with IgG isotype ctrl, anti–PD-1 ab, and anti–PD-1/NLRP3i (n = 5 mice/group). (H) Statistical analysis performed using 2-way ANOVA followed by Tukey’s multiple-comparison test. (I and J) Statistical analysis performed using a 1-way ANOVA followed by Tukey’s multiple-comparison test. All data expressed as mean values ± SEM. *P < 0.05, **P < 0.005, ***P < 0.0005, ****P < 0.00005.
Cumulatively, these data indicate that the tumor-intrinsic NLRP3 inflammasome contributes to immune evasion via multiple mechanisms and that blocking this pathway may facilitate anti–PD-1 responses in immunotherapy-refractory tumors, such as GE adenocarcinoma. Based on these findings, we sought to examine the role of the tumor-intrinsic NLRP3 pathway in chemoimmunotherapy resistance in patients with GE adenocarcinoma.
Tumor-intrinsic NLRP3 inflammasome activity and tumor NLRP3 amplification is associated with chemoimmunotherapy resistance in patients with advanced GE cancer. An opportunity to further explore the role of the tumor-intrinsic NLRP3 signaling pathway in immune evasion in GE adenocarcinoma patients was provided by the phase II KeyLARGO clinical trial, which evaluated first-line capecitabine/oxaliplatin chemotherapy with pembrolizumab (anti–PD-1 antibody) in unresectable stage III or stage IV microsatellite-stable, human epidermal growth factor receptor 2–negative GE adenocarcinoma patients following an 8-day lead-in of pembrolizumab monotherapy (28). In this study, both tissue and blood specimens were acquired at baseline and at day 8 prior to initiating chemotherapy, providing a window of opportunity to analyze the impact of anti–PD-1 immunotherapy alone on GE adenocarcinoma tissues (Figure 6, A and B, and Supplemental Table 6). Notably, prior studies observed no relationship between PD-L1 Combined Positive Score testing in these tumor tissue specimens and treatment response in this patient cohort (Supplemental Figure 7A) (28). Paired tissue specimens were harvested from 10 patients, evaluated by a board-certified gastrointestinal pathologist, and analyzed utilizing IF microscopy. We found an increased number of tumor-infiltrating CD8+ T cells at day 8 relative to baseline following treatment with pembrolizumab (Figure 6C). This analysis also demonstrated an increased number of baseline tumor-infiltrating CD8+ T cells in responders versus nonresponders (Figure 6D). Furthermore, this increase in tumor-infiltrating CD8+ T cells following pembrolizumab immunotherapy was noted to occur only in responding patients (Figure 6E). Using elastase as a marker of neutrophils or PMNs, an increase in this cell population was also noted to occur by day 8 following pembrolizumab immunotherapy (Figure 6F). Baseline PMNs were elevated in nonresponders relative to responding patients, and an increase in PMNs with pembrolizumab immunotherapy was noted to occur only in nonresponding patients (Figure 6, G and H). Assuming that these PMNs are functionally suppressive, and therefore consistent with PMN-MDSCs, these data are compatible with our prior work in melanoma showing an increase in tumor-infiltrating PMN-MDSCs upon treatment with anti–PD-1 antibody in resistant tumors (5). As we previously showed that this effect was secondary to activation of the tumor-intrinsic NLRP3 inflammasome, we assessed these tissue specimens using the NLRP3-ASC PLA and found the tumors of nonresponders to exhibit elevated NLRP3 signaling activity (Figure 6I). In light of this relationship, we then evaluated the accompanying plasma samples from an expanded patient cohort derived from this study and found elevated baseline HSP70 plasma levels to correlate with progressive disease (Figure 6J). Similar to our previous findings related to PMNs, we also found only nonresponding patients to demonstrate an increase in plasma HSP70 upon treatment with pembrolizumab immunotherapy (Figure 6K). Notably, baseline levels of CD8+ T cells and PMNs, as well as plasma HSP70, correlated with tumor NLRP3 signaling activity based on the NLRP3-ASC PLA (Supplemental Figure 7B). Given our prior data implicating NLRP3 amplification as an important factor determining response to checkpoint inhibitor immunotherapy in melanoma (Figure 1, C–E), we also performed NLRP3 FISH analysis of these GE adenocarcinoma tissue specimens. Consistent with our previous studies, this work determined that GE adenocarcinomas exhibiting baseline NLRP3 amplification failed to respond to this chemoimmunotherapy regimen (Figure 6L). Indeed, patients harboring GE adenocarcinomas exhibiting elevated levels of NLRP3 amplification were found to associate with an inferior PFS (P = 0.0087) and overall survival (P = 0.0091) relative to those patients with nonamplified tumors (Figure 6M). We then utilized the NLRP3-tsig described above and found it to also correlate with the PMN-MDSC signature and with disease-free survival in the gastric adenocarcinoma TCGA dataset (Figure 6, N and O). Although these data are derived from a limited patient cohort, the results are consistent with our preclinical studies, suggesting that tumor NLRP3 amplification and enhanced NLRP3 signaling correlate with anti–PD-1 resistance in GE adenocarcinoma.
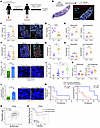 Figure 6
Elevated tumor-intrinsic NLRP3 activity and NLRP3 amplification correlate with anti–PD-1 resistance in patients with advanced gastroesophageal adenocarcinoma. (A) KeyLARGO clinical protocol included a pembrolizumab-only lead-in phase. Data collected from 5 responding (R) and 5 non-responding (NR) patients. (B) H&E, IF, and spatial transcriptomics workflow on GE adenocarcinoma tissue specimens. (C) Left, mean CD8+ T cells in ROIs day 0 and day 8. Original magnification, 40×. ROIs, regions of interest. Right, representative ROIs in a responder on day 0 and day 8. Scale bar = 200 μm. Green, CD8. Cyan, pan-cytokeratin (pan-CK). Red, elastase. Dark blue, nuclei. (D) Baseline mean CD8+ T cells in ROIs based on CD8 IF collected from R and NR. (E) Mean CD8+ T cells in ROIs based on CD8 IF on day 0 and day 8 from R (left) and NR (right). (F) Left, mean neutrophils in ROIs based on elastase IF collected on day 0 and day 8. Right, representative ROIs in an NR patient on day 0 and day 8. Scale bar = 200 μm. (G) Baseline mean neutrophils in ROIs based on elastase IF collected from R and NR. (H) Mean neutrophils in ROIs based on elastase IF collected on day 0 and day 8 from R (left) and NR (right). (I) Left, baseline NLRP3-ASC PLA dots per hpf collected from R and NR. Right, representative PLA IF field in R and NR. Scale bar = 5 μm. (J) Baseline plasma HSP70 levels categorized according to best objective response. CR, complete response; PR, partial response; SD, stable disease; PD, progressive disease. One-way ANOVA followed by Tukey’s multiple comparisons test. (K) Baseline HSP70 levels collected on day 0 and day 8 from R (left) and NR (right). (L) NLRP3/CEP1 copy number ratio based on FISH collected from R and NR. Right, representative IF field in R and NR. Red, NLRP3 probe. Green, chromosome enumeration probe for chromosome 1 (CEP1). Original magnification, 100×. Scale bar = 5 μm. (M) PFS (left) and OS (right) stratified based on NLRP3 amplification status. Log-rank test. (N) ssGSEA used to correlate PMN-MDSC-sig with NLRP3-tsig in the gastric cancer (STAD) TCGA. (O) Disease-free survival of patients with gastric cancer in TCGA (STAD) based on the NLRP3-tsig transcriptional signature (High, above the median; Low, below the median). Log-rank test. All other statistical analyses performed using unpaired t tests. Data expressed as mean values ± SEM. *P < 0.05, **P < 0.005.
Tumor-intrinsic NLRP3 expression levels inversely correlate with NLRC5 and MHC class I expression levels in patients with advanced GE cancer. Applying spatial transcriptomics to day 0 and day 8 paired tumor specimens derived from the GE adenocarcinoma patient cohort undergoing anti–PD-1 immunotherapy, we found NLRP3 expression levels to be elevated in nonresponding relative to responding patients (Figure 7A). We further found increased expression of genes associated with the NLRP3 inflammasome complex in baseline tumor tissue specimens based on KEGG pathway analysis in nonresponding patients while these tumor tissues also demonstrated increased NLRP3 inflammasome expression levels by day 8 of anti–PD-1 therapy relative to day 0 (Figure 7B). Other transcripts associated with the tumor-intrinsic NLRP3 signaling pathway, such as CXCL5, were also found to be upregulated in nonresponding patients (Supplemental Figure 8A) (5). This transcriptional analysis further revealed several genes associated with MHC class I antigen processing and presentation to be downregulated by day 8 of anti–PD-1 therapy, including B2M (β2-microglobulin), TAP1/2 (transporter-associated with antigen processing-1/2), and several HLA (human leukocyte antigen) alleles (Figure 7C). Interestingly, a decrease in HLA-A and HLA-B expression by day 8 of anti–PD-1 immunotherapy was also found to be restricted to the tumor tissues harvested from nonresponders, while this was not observed in the tumor tissues of responders (Figure 7D). Indeed, these observations were concordant with pan-MHC class I IHC studies, where increased expression levels of MHC class I were noted exclusively in the tumor tissues of responders (Figure 7D). In light of our previous data, we also examined the relationship between NLRP3 activation and NLRC5 expression levels in these tissues. These studies confirmed NLRC5 expression levels were also diminished in day 8 relative to day 0 tumor tissues while IHC showed elevated NLRC5 expression levels in responding relative to nonresponding patients with GE adenocarcinoma (Figure 7, E and F). Interestingly, transcripts associated with cellular stress-related pathways were also found to be increased, while transcripts associated with antigen processing and presentation were diminished in the same nonresponding patients following anti–PD-1 immunotherapy (Figure 7G) (29).
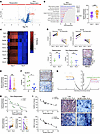 Figure 7
Tumor NLRP3 expression inversely correlates with diminished NLRC5 and pan-MHC class I expression in nonresponding patients with GE adenocarcinoma. (A) Volcano plot of spatial transcriptomic (ST) analysis of all selected ROIs in responders and nonresponders. (B) Left, KEGG pathway analysis of ST data derived from nonresponders. Right, NLRP3 transcript counts per ROI in tumor tissues collected on day 0 and day 8. (C) Heatmap of select mean MHC class I–associated transcript levels collected on day 0 and day 8 from nonresponders. Right, Z-scores. (D) Top, tumor HLA-A and HLA-B expression levels based on Z-score derived from the same responding and nonresponding patients on day 0 and day 8. Bottom, H-scores determined for pan-MHC class I expression based on IHC on day 0 and day 8 tumor tissues derived from responders and nonresponders. Right, representative pan-MHC class I IHC images. Scale bar = 20 μm. (E) NLRC5 transcript counts per ROI in tumor tissues collected on day 0 and day 8. (F) H-scores determined for NLRC5 expression based on IHC of tumor tissues derived from responders (R) and nonresponders (NR). Right, representative NLRC5 IHC images. Scale bar = 20 μm. (G) Volcano plot of KEGG pathway ST analysis of nonresponding tumor tissues. (H) Top, Spearman’s correlation of NLRC5 and NLRP3 expression levels based on ROI ST analysis of nonresponding tumor tissue specimens. Bottom, tumor NLRP3 and NLRC5 expression levels derived from the same patients on day 0 and day 8. (I) Left, Spearman’s correlation of NLRP3-ASC PLA levels with NLRC5 and pan-MHC class I H-scores in human melanoma tissues. Right, representative images of NLRC5 and pan-MHC class I IHC analysis of human melanoma tissues with low and high NLRP3-ASC PLA levels. Scale bar = 20 μm. B, D–F, and H: Statistical analysis performed using unpaired t tests. Data expressed as mean values ± SEM. *P < 0.05, **P < 0.005. ***P < 0.0005.
Consistent with our prior work, we also found tumor tissues with elevated NLRP3 expression to exhibit lower NLRC5 transcriptional levels (Figure 7H). While NLRP3 expression levels uniformly increased in nonresponders in day 8 tumor tissues, NLRC5 expression levels decreased in these same tumors by day 8 (Figure 7H). Further analysis of individual tumor regions with increased CD8+ T cells and PMNs correlated with enhanced expression of the NLRP3 inflammasome and diminished MHC class I–associated gene expression (Supplemental Figure 8B). Indeed, we found individual MHC class I–associated transcripts to be elevated in CD8+ T cell–rich regions and diminished in PMN-rich regions (Supplemental Figure 8C). This reciprocal relationship was true for select myeloid markers that were elevated in PMN-rich regions and downregulated in CD8+ T cell–rich regions (Supplemental Figure 8C). To confirm that this relationship between NLRP3 and NLRC5/MHC class I also existed in other tumors beyond GE adenocarcinoma, we turned again to tumor tissue specimens harvested from patients with melanoma and performed the NLRP3-ASC PLA described above along with NLRC5 and pan-MHC class I IHC. This study verified that tumor-intrinsic NLRP3 inflammasome activity inversely correlates with both NLRC5 and MHC class I expression in patient-derived melanoma tissues, consistent with our findings in the transgenic BRAFV600E PTEN–/– melanoma model (Figure 7I). Overall, our studies in patient-derived GE adenocarcinoma tissues support our preclinical mechanistic data and further indicate that the activation of the tumor-intrinsic NLRP3 pathway suppresses MHC class I expression and correlates with inferior response to treatment.


Copyright © 2026 American Society for Clinical Investigation
ISSN: 0021-9738 (print), 1558-8238 (online)