
Advertisement
Research ArticleAIDS/HIVImmunology
Open Access |  10.1172/JCI198294
Boosting SIV-specific CD8+ T cell responses prior to ART interruption extends time to SIVmac239 rebound
Were R. Omange,1,2 Benjamin D. Varco-Merth,1,2 Omo Fadeyi,1,2 Alejandra Marenco,1,2 Hiroshi Takata,1,2 Derick M. Duell,1,2 William D. Goodwin,1,2 Paula Armitage,1,2 Christine M. Fennessey,3 Emek Kose,3 Taina T. Immonen,3 Ewelina Kosmider,4 William J. Bosche,3 Randy Fast,3 Chris Homick,3 Kelli Oswald,3 Rebecca Shoemaker,3 Rachele Bochart,1,2 Rhonda MacAllister,2 Caralyn S. Labriola,1,2 Jeremy V. Smedley,1,2 Michael K. Axthelm,1,2 Paul T. Edlefsen,4 Brandon F. Keele,3 Jeffrey D. Lifson,3 Janina Gergen,5 Benjamin Petsch,5 Susanne Rauch,5 Louis J. Picker,1,2 and Afam A. Okoye1,2
1Vaccine and Gene Therapy Institute and
2Oregon National Primate Research Center, Oregon Health & Science University, Beaverton, Oregon, USA.
3AIDS and Cancer Virus Program, Frederick National Laboratory for Cancer Research, Frederick, Maryland, USA.
4Fred Hutchinson Cancer Center, Seattle, Washington, USA.
5CureVac SE, Tübingen, Germany.
Address correspondence to: Afam A. Okoye, Vaccine and Gene Therapy Institute, Oregon Health & Science University, West Campus, 505 NW 185th Ave., Beaverton, Oregon 97006, USA. Phone: 503.418.2752; Email: okoyea@ohsu.edu.
Find articles by
Omange, W.
in:
PubMed
|
Google Scholar
|

1Vaccine and Gene Therapy Institute and
2Oregon National Primate Research Center, Oregon Health & Science University, Beaverton, Oregon, USA.
3AIDS and Cancer Virus Program, Frederick National Laboratory for Cancer Research, Frederick, Maryland, USA.
4Fred Hutchinson Cancer Center, Seattle, Washington, USA.
5CureVac SE, Tübingen, Germany.
Address correspondence to: Afam A. Okoye, Vaccine and Gene Therapy Institute, Oregon Health & Science University, West Campus, 505 NW 185th Ave., Beaverton, Oregon 97006, USA. Phone: 503.418.2752; Email: okoyea@ohsu.edu.
Find articles by Varco-Merth, B. in: PubMed | Google Scholar
1Vaccine and Gene Therapy Institute and
2Oregon National Primate Research Center, Oregon Health & Science University, Beaverton, Oregon, USA.
3AIDS and Cancer Virus Program, Frederick National Laboratory for Cancer Research, Frederick, Maryland, USA.
4Fred Hutchinson Cancer Center, Seattle, Washington, USA.
5CureVac SE, Tübingen, Germany.
Address correspondence to: Afam A. Okoye, Vaccine and Gene Therapy Institute, Oregon Health & Science University, West Campus, 505 NW 185th Ave., Beaverton, Oregon 97006, USA. Phone: 503.418.2752; Email: okoyea@ohsu.edu.
Find articles by Fadeyi, O. in: PubMed | Google Scholar
1Vaccine and Gene Therapy Institute and
2Oregon National Primate Research Center, Oregon Health & Science University, Beaverton, Oregon, USA.
3AIDS and Cancer Virus Program, Frederick National Laboratory for Cancer Research, Frederick, Maryland, USA.
4Fred Hutchinson Cancer Center, Seattle, Washington, USA.
5CureVac SE, Tübingen, Germany.
Address correspondence to: Afam A. Okoye, Vaccine and Gene Therapy Institute, Oregon Health & Science University, West Campus, 505 NW 185th Ave., Beaverton, Oregon 97006, USA. Phone: 503.418.2752; Email: okoyea@ohsu.edu.
Find articles by Marenco, A. in: PubMed | Google Scholar
1Vaccine and Gene Therapy Institute and
2Oregon National Primate Research Center, Oregon Health & Science University, Beaverton, Oregon, USA.
3AIDS and Cancer Virus Program, Frederick National Laboratory for Cancer Research, Frederick, Maryland, USA.
4Fred Hutchinson Cancer Center, Seattle, Washington, USA.
5CureVac SE, Tübingen, Germany.
Address correspondence to: Afam A. Okoye, Vaccine and Gene Therapy Institute, Oregon Health & Science University, West Campus, 505 NW 185th Ave., Beaverton, Oregon 97006, USA. Phone: 503.418.2752; Email: okoyea@ohsu.edu.
Find articles by
Takata, H.
in:
PubMed
|
Google Scholar
|
1Vaccine and Gene Therapy Institute and
2Oregon National Primate Research Center, Oregon Health & Science University, Beaverton, Oregon, USA.
3AIDS and Cancer Virus Program, Frederick National Laboratory for Cancer Research, Frederick, Maryland, USA.
4Fred Hutchinson Cancer Center, Seattle, Washington, USA.
5CureVac SE, Tübingen, Germany.
Address correspondence to: Afam A. Okoye, Vaccine and Gene Therapy Institute, Oregon Health & Science University, West Campus, 505 NW 185th Ave., Beaverton, Oregon 97006, USA. Phone: 503.418.2752; Email: okoyea@ohsu.edu.
Find articles by Duell, D. in: PubMed | Google Scholar
1Vaccine and Gene Therapy Institute and
2Oregon National Primate Research Center, Oregon Health & Science University, Beaverton, Oregon, USA.
3AIDS and Cancer Virus Program, Frederick National Laboratory for Cancer Research, Frederick, Maryland, USA.
4Fred Hutchinson Cancer Center, Seattle, Washington, USA.
5CureVac SE, Tübingen, Germany.
Address correspondence to: Afam A. Okoye, Vaccine and Gene Therapy Institute, Oregon Health & Science University, West Campus, 505 NW 185th Ave., Beaverton, Oregon 97006, USA. Phone: 503.418.2752; Email: okoyea@ohsu.edu.
Find articles by Goodwin, W. in: PubMed | Google Scholar
1Vaccine and Gene Therapy Institute and
2Oregon National Primate Research Center, Oregon Health & Science University, Beaverton, Oregon, USA.
3AIDS and Cancer Virus Program, Frederick National Laboratory for Cancer Research, Frederick, Maryland, USA.
4Fred Hutchinson Cancer Center, Seattle, Washington, USA.
5CureVac SE, Tübingen, Germany.
Address correspondence to: Afam A. Okoye, Vaccine and Gene Therapy Institute, Oregon Health & Science University, West Campus, 505 NW 185th Ave., Beaverton, Oregon 97006, USA. Phone: 503.418.2752; Email: okoyea@ohsu.edu.
Find articles by Armitage, P. in: PubMed | Google Scholar
1Vaccine and Gene Therapy Institute and
2Oregon National Primate Research Center, Oregon Health & Science University, Beaverton, Oregon, USA.
3AIDS and Cancer Virus Program, Frederick National Laboratory for Cancer Research, Frederick, Maryland, USA.
4Fred Hutchinson Cancer Center, Seattle, Washington, USA.
5CureVac SE, Tübingen, Germany.
Address correspondence to: Afam A. Okoye, Vaccine and Gene Therapy Institute, Oregon Health & Science University, West Campus, 505 NW 185th Ave., Beaverton, Oregon 97006, USA. Phone: 503.418.2752; Email: okoyea@ohsu.edu.
Find articles by
Fennessey, C.
in:
PubMed
|
Google Scholar
|
1Vaccine and Gene Therapy Institute and
2Oregon National Primate Research Center, Oregon Health & Science University, Beaverton, Oregon, USA.
3AIDS and Cancer Virus Program, Frederick National Laboratory for Cancer Research, Frederick, Maryland, USA.
4Fred Hutchinson Cancer Center, Seattle, Washington, USA.
5CureVac SE, Tübingen, Germany.
Address correspondence to: Afam A. Okoye, Vaccine and Gene Therapy Institute, Oregon Health & Science University, West Campus, 505 NW 185th Ave., Beaverton, Oregon 97006, USA. Phone: 503.418.2752; Email: okoyea@ohsu.edu.
Find articles by Kose, E. in: PubMed | Google Scholar
1Vaccine and Gene Therapy Institute and
2Oregon National Primate Research Center, Oregon Health & Science University, Beaverton, Oregon, USA.
3AIDS and Cancer Virus Program, Frederick National Laboratory for Cancer Research, Frederick, Maryland, USA.
4Fred Hutchinson Cancer Center, Seattle, Washington, USA.
5CureVac SE, Tübingen, Germany.
Address correspondence to: Afam A. Okoye, Vaccine and Gene Therapy Institute, Oregon Health & Science University, West Campus, 505 NW 185th Ave., Beaverton, Oregon 97006, USA. Phone: 503.418.2752; Email: okoyea@ohsu.edu.
Find articles by Immonen, T. in: PubMed | Google Scholar
1Vaccine and Gene Therapy Institute and
2Oregon National Primate Research Center, Oregon Health & Science University, Beaverton, Oregon, USA.
3AIDS and Cancer Virus Program, Frederick National Laboratory for Cancer Research, Frederick, Maryland, USA.
4Fred Hutchinson Cancer Center, Seattle, Washington, USA.
5CureVac SE, Tübingen, Germany.
Address correspondence to: Afam A. Okoye, Vaccine and Gene Therapy Institute, Oregon Health & Science University, West Campus, 505 NW 185th Ave., Beaverton, Oregon 97006, USA. Phone: 503.418.2752; Email: okoyea@ohsu.edu.
Find articles by Kosmider, E. in: PubMed | Google Scholar
1Vaccine and Gene Therapy Institute and
2Oregon National Primate Research Center, Oregon Health & Science University, Beaverton, Oregon, USA.
3AIDS and Cancer Virus Program, Frederick National Laboratory for Cancer Research, Frederick, Maryland, USA.
4Fred Hutchinson Cancer Center, Seattle, Washington, USA.
5CureVac SE, Tübingen, Germany.
Address correspondence to: Afam A. Okoye, Vaccine and Gene Therapy Institute, Oregon Health & Science University, West Campus, 505 NW 185th Ave., Beaverton, Oregon 97006, USA. Phone: 503.418.2752; Email: okoyea@ohsu.edu.
Find articles by Bosche, W. in: PubMed | Google Scholar
1Vaccine and Gene Therapy Institute and
2Oregon National Primate Research Center, Oregon Health & Science University, Beaverton, Oregon, USA.
3AIDS and Cancer Virus Program, Frederick National Laboratory for Cancer Research, Frederick, Maryland, USA.
4Fred Hutchinson Cancer Center, Seattle, Washington, USA.
5CureVac SE, Tübingen, Germany.
Address correspondence to: Afam A. Okoye, Vaccine and Gene Therapy Institute, Oregon Health & Science University, West Campus, 505 NW 185th Ave., Beaverton, Oregon 97006, USA. Phone: 503.418.2752; Email: okoyea@ohsu.edu.
Find articles by Fast, R. in: PubMed | Google Scholar
1Vaccine and Gene Therapy Institute and
2Oregon National Primate Research Center, Oregon Health & Science University, Beaverton, Oregon, USA.
3AIDS and Cancer Virus Program, Frederick National Laboratory for Cancer Research, Frederick, Maryland, USA.
4Fred Hutchinson Cancer Center, Seattle, Washington, USA.
5CureVac SE, Tübingen, Germany.
Address correspondence to: Afam A. Okoye, Vaccine and Gene Therapy Institute, Oregon Health & Science University, West Campus, 505 NW 185th Ave., Beaverton, Oregon 97006, USA. Phone: 503.418.2752; Email: okoyea@ohsu.edu.
Find articles by Homick, C. in: PubMed | Google Scholar
1Vaccine and Gene Therapy Institute and
2Oregon National Primate Research Center, Oregon Health & Science University, Beaverton, Oregon, USA.
3AIDS and Cancer Virus Program, Frederick National Laboratory for Cancer Research, Frederick, Maryland, USA.
4Fred Hutchinson Cancer Center, Seattle, Washington, USA.
5CureVac SE, Tübingen, Germany.
Address correspondence to: Afam A. Okoye, Vaccine and Gene Therapy Institute, Oregon Health & Science University, West Campus, 505 NW 185th Ave., Beaverton, Oregon 97006, USA. Phone: 503.418.2752; Email: okoyea@ohsu.edu.
Find articles by Oswald, K. in: PubMed | Google Scholar
1Vaccine and Gene Therapy Institute and
2Oregon National Primate Research Center, Oregon Health & Science University, Beaverton, Oregon, USA.
3AIDS and Cancer Virus Program, Frederick National Laboratory for Cancer Research, Frederick, Maryland, USA.
4Fred Hutchinson Cancer Center, Seattle, Washington, USA.
5CureVac SE, Tübingen, Germany.
Address correspondence to: Afam A. Okoye, Vaccine and Gene Therapy Institute, Oregon Health & Science University, West Campus, 505 NW 185th Ave., Beaverton, Oregon 97006, USA. Phone: 503.418.2752; Email: okoyea@ohsu.edu.
Find articles by Shoemaker, R. in: PubMed | Google Scholar
1Vaccine and Gene Therapy Institute and
2Oregon National Primate Research Center, Oregon Health & Science University, Beaverton, Oregon, USA.
3AIDS and Cancer Virus Program, Frederick National Laboratory for Cancer Research, Frederick, Maryland, USA.
4Fred Hutchinson Cancer Center, Seattle, Washington, USA.
5CureVac SE, Tübingen, Germany.
Address correspondence to: Afam A. Okoye, Vaccine and Gene Therapy Institute, Oregon Health & Science University, West Campus, 505 NW 185th Ave., Beaverton, Oregon 97006, USA. Phone: 503.418.2752; Email: okoyea@ohsu.edu.
Find articles by Bochart, R. in: PubMed | Google Scholar
1Vaccine and Gene Therapy Institute and
2Oregon National Primate Research Center, Oregon Health & Science University, Beaverton, Oregon, USA.
3AIDS and Cancer Virus Program, Frederick National Laboratory for Cancer Research, Frederick, Maryland, USA.
4Fred Hutchinson Cancer Center, Seattle, Washington, USA.
5CureVac SE, Tübingen, Germany.
Address correspondence to: Afam A. Okoye, Vaccine and Gene Therapy Institute, Oregon Health & Science University, West Campus, 505 NW 185th Ave., Beaverton, Oregon 97006, USA. Phone: 503.418.2752; Email: okoyea@ohsu.edu.
Find articles by MacAllister, R. in: PubMed | Google Scholar
1Vaccine and Gene Therapy Institute and
2Oregon National Primate Research Center, Oregon Health & Science University, Beaverton, Oregon, USA.
3AIDS and Cancer Virus Program, Frederick National Laboratory for Cancer Research, Frederick, Maryland, USA.
4Fred Hutchinson Cancer Center, Seattle, Washington, USA.
5CureVac SE, Tübingen, Germany.
Address correspondence to: Afam A. Okoye, Vaccine and Gene Therapy Institute, Oregon Health & Science University, West Campus, 505 NW 185th Ave., Beaverton, Oregon 97006, USA. Phone: 503.418.2752; Email: okoyea@ohsu.edu.
Find articles by
Labriola, C.
in:
PubMed
|
Google Scholar
|
1Vaccine and Gene Therapy Institute and
2Oregon National Primate Research Center, Oregon Health & Science University, Beaverton, Oregon, USA.
3AIDS and Cancer Virus Program, Frederick National Laboratory for Cancer Research, Frederick, Maryland, USA.
4Fred Hutchinson Cancer Center, Seattle, Washington, USA.
5CureVac SE, Tübingen, Germany.
Address correspondence to: Afam A. Okoye, Vaccine and Gene Therapy Institute, Oregon Health & Science University, West Campus, 505 NW 185th Ave., Beaverton, Oregon 97006, USA. Phone: 503.418.2752; Email: okoyea@ohsu.edu.
Find articles by Smedley, J. in: PubMed | Google Scholar
1Vaccine and Gene Therapy Institute and
2Oregon National Primate Research Center, Oregon Health & Science University, Beaverton, Oregon, USA.
3AIDS and Cancer Virus Program, Frederick National Laboratory for Cancer Research, Frederick, Maryland, USA.
4Fred Hutchinson Cancer Center, Seattle, Washington, USA.
5CureVac SE, Tübingen, Germany.
Address correspondence to: Afam A. Okoye, Vaccine and Gene Therapy Institute, Oregon Health & Science University, West Campus, 505 NW 185th Ave., Beaverton, Oregon 97006, USA. Phone: 503.418.2752; Email: okoyea@ohsu.edu.
Find articles by
Axthelm, M.
in:
PubMed
|
Google Scholar
|
1Vaccine and Gene Therapy Institute and
2Oregon National Primate Research Center, Oregon Health & Science University, Beaverton, Oregon, USA.
3AIDS and Cancer Virus Program, Frederick National Laboratory for Cancer Research, Frederick, Maryland, USA.
4Fred Hutchinson Cancer Center, Seattle, Washington, USA.
5CureVac SE, Tübingen, Germany.
Address correspondence to: Afam A. Okoye, Vaccine and Gene Therapy Institute, Oregon Health & Science University, West Campus, 505 NW 185th Ave., Beaverton, Oregon 97006, USA. Phone: 503.418.2752; Email: okoyea@ohsu.edu.
Find articles by
Edlefsen, P.
in:
PubMed
|
Google Scholar
|
1Vaccine and Gene Therapy Institute and
2Oregon National Primate Research Center, Oregon Health & Science University, Beaverton, Oregon, USA.
3AIDS and Cancer Virus Program, Frederick National Laboratory for Cancer Research, Frederick, Maryland, USA.
4Fred Hutchinson Cancer Center, Seattle, Washington, USA.
5CureVac SE, Tübingen, Germany.
Address correspondence to: Afam A. Okoye, Vaccine and Gene Therapy Institute, Oregon Health & Science University, West Campus, 505 NW 185th Ave., Beaverton, Oregon 97006, USA. Phone: 503.418.2752; Email: okoyea@ohsu.edu.
Find articles by
Keele, B.
in:
PubMed
|
Google Scholar
|
1Vaccine and Gene Therapy Institute and
2Oregon National Primate Research Center, Oregon Health & Science University, Beaverton, Oregon, USA.
3AIDS and Cancer Virus Program, Frederick National Laboratory for Cancer Research, Frederick, Maryland, USA.
4Fred Hutchinson Cancer Center, Seattle, Washington, USA.
5CureVac SE, Tübingen, Germany.
Address correspondence to: Afam A. Okoye, Vaccine and Gene Therapy Institute, Oregon Health & Science University, West Campus, 505 NW 185th Ave., Beaverton, Oregon 97006, USA. Phone: 503.418.2752; Email: okoyea@ohsu.edu.
Find articles by Lifson, J. in: PubMed | Google Scholar
1Vaccine and Gene Therapy Institute and
2Oregon National Primate Research Center, Oregon Health & Science University, Beaverton, Oregon, USA.
3AIDS and Cancer Virus Program, Frederick National Laboratory for Cancer Research, Frederick, Maryland, USA.
4Fred Hutchinson Cancer Center, Seattle, Washington, USA.
5CureVac SE, Tübingen, Germany.
Address correspondence to: Afam A. Okoye, Vaccine and Gene Therapy Institute, Oregon Health & Science University, West Campus, 505 NW 185th Ave., Beaverton, Oregon 97006, USA. Phone: 503.418.2752; Email: okoyea@ohsu.edu.
Find articles by Gergen, J. in: PubMed | Google Scholar
1Vaccine and Gene Therapy Institute and
2Oregon National Primate Research Center, Oregon Health & Science University, Beaverton, Oregon, USA.
3AIDS and Cancer Virus Program, Frederick National Laboratory for Cancer Research, Frederick, Maryland, USA.
4Fred Hutchinson Cancer Center, Seattle, Washington, USA.
5CureVac SE, Tübingen, Germany.
Address correspondence to: Afam A. Okoye, Vaccine and Gene Therapy Institute, Oregon Health & Science University, West Campus, 505 NW 185th Ave., Beaverton, Oregon 97006, USA. Phone: 503.418.2752; Email: okoyea@ohsu.edu.
Find articles by Petsch, B. in: PubMed | Google Scholar
1Vaccine and Gene Therapy Institute and
2Oregon National Primate Research Center, Oregon Health & Science University, Beaverton, Oregon, USA.
3AIDS and Cancer Virus Program, Frederick National Laboratory for Cancer Research, Frederick, Maryland, USA.
4Fred Hutchinson Cancer Center, Seattle, Washington, USA.
5CureVac SE, Tübingen, Germany.
Address correspondence to: Afam A. Okoye, Vaccine and Gene Therapy Institute, Oregon Health & Science University, West Campus, 505 NW 185th Ave., Beaverton, Oregon 97006, USA. Phone: 503.418.2752; Email: okoyea@ohsu.edu.
Find articles by Rauch, S. in: PubMed | Google Scholar
1Vaccine and Gene Therapy Institute and
2Oregon National Primate Research Center, Oregon Health & Science University, Beaverton, Oregon, USA.
3AIDS and Cancer Virus Program, Frederick National Laboratory for Cancer Research, Frederick, Maryland, USA.
4Fred Hutchinson Cancer Center, Seattle, Washington, USA.
5CureVac SE, Tübingen, Germany.
Address correspondence to: Afam A. Okoye, Vaccine and Gene Therapy Institute, Oregon Health & Science University, West Campus, 505 NW 185th Ave., Beaverton, Oregon 97006, USA. Phone: 503.418.2752; Email: okoyea@ohsu.edu.
Find articles by
Picker, L.
in:
PubMed
|
Google Scholar
|
1Vaccine and Gene Therapy Institute and
2Oregon National Primate Research Center, Oregon Health & Science University, Beaverton, Oregon, USA.
3AIDS and Cancer Virus Program, Frederick National Laboratory for Cancer Research, Frederick, Maryland, USA.
4Fred Hutchinson Cancer Center, Seattle, Washington, USA.
5CureVac SE, Tübingen, Germany.
Address correspondence to: Afam A. Okoye, Vaccine and Gene Therapy Institute, Oregon Health & Science University, West Campus, 505 NW 185th Ave., Beaverton, Oregon 97006, USA. Phone: 503.418.2752; Email: okoyea@ohsu.edu.
Find articles by Okoye, A. in: PubMed | Google Scholar
Published January 29, 2026 - More info
J Clin Invest. 2026;136(6):e198294. https://doi.org/10.1172/JCI198294.
© 2026 Omange et al. This work is licensed under the Creative Commons Attribution 4.0 International License. To view a copy of this license, visit http://creativecommons.org/licenses/by/4.0/.
Received: July 22, 2025; Accepted: January 16, 2026


-
Results
Study design. The goals of this study were 2-fold: (a) to evaluate whether increasing frequencies and functional activity of SIV-specific CD8+ T cells during ART, including with a boost just prior to ATI, can delay the rate and extent of SIVmac239 rebound, which would provide evidence that CD8+ T cells can intercept foci of reactivating, persistent, tissue-level infections, and (b) to determine whether proactively inducing the CD8+ T cell response to precede rebounding viremia can support durable post-ART viral control. To test this, we initially constructed a nucleoside unmodified mRNA vaccine to express full-length SIVmac239 Gag (mRNA/SIVgag) and encapsulated in lipid nanoparticles (LNPs), with the aim of specifically boosting Gag-specific CD8+ T cell responses, in part due to the important role of Gag responses in promoting viral control (23), comparing this Gag-expressing vaccine to a similar construct that expressed an irrelevant antigen (rabies virus glycoprotein) (24). The study included 16 RMs, which were intravenously inoculated with 5,000 IU of the barcoded SIVmac239M viral stock, followed by ART consisting of tenofovir disoproxil fumarate, emtricitabine, and dolutegravir starting 9 days postinfection (dpi) (25) (Figure 1A). After stable ART suppression for approximately 58 weeks, the RMs were divided into 2 balanced groups based on age, sex, and MHC-I alleles (Supplemental Table 1; supplemental material available online with this article; https://doi.org/10.1172/JCI198294DS1). These groups received 5 intramuscular injections of either the mRNA/SIVgag (n = 8) or mRNA/control vaccines (n = 8) at 59, 62, 65, 79, and 106 weeks postinfection (wpi), while receiving continued ART, with the final immunization occurring approximately 2 weeks prior to ATI (~108 wpi).
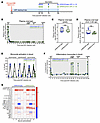 Figure 1
mRNA/SIVgag vaccination increases monocyte activation in SIV-infected RM on ART. (A) Schematic representation of the study protocol, including SIVmac239 infection, initiation of ART at 9 dpi, and vaccination with either mRNA/SIVgag or mRNA/control vaccines at 59, 62, 65, 79, and 106 wpi. (B) Mean (+SEM) PVL profiles of RMs in the mRNA/SIVgag vaccine group (n = 8) compared with mRNA/control group (n = 8), prior to ART discontinuation. (C and D) Comparison of peak PVL (C) and AUC of PVL (D) from 0 to 85 dpi between the 2 vaccine groups. Box-and-whisker plots show jittered points, a box from first to third quartiles (IQR), and a line at the median, with whiskers down to the minimum and up to the maximum value. (E) CD169 expression on the designated monocyte subsets in blood at 0, 1, and 7 days after vaccination. (F) Mean (+SEM) frequencies of CD14+CD16+ monocytes as a fraction of CD3–CD20–CD8–HLA-DR+ lymphocytes in blood of RMs in the mRNA/SIVgag vaccine group (n = 8) versus the mRNA/control group (n = 8), prior to ART discontinuation. (G) Heatmap showing change in plasma cytokine/chemokine levels in each vaccine group between 0 and 24 hours after vaccination. Statistical significance between groups was determined by Wilcoxon’s rank-sum test; P values ≤ 0.05 are indicated.
In response to ART, PVL declined to below 15 SIV RNA copies/mL in most RMs by 8 wpi (Figure 1B). Peak PVL and viral burden as measured by the AUC of PVL between 0 and 12 wpi were not statistically different between mRNA/SIVgag-vaccinated RMs and control group (Figure 1, C and D). Each mRNA vaccination was associated with a substantial, yet transient, increase in the activation marker CD169 on all monocyte subsets in blood, including CD14+CD16–, CD14+CD16+, and CD14–CD16+ monocytes (Figure 1E and Supplemental Figure 1A). Longitudinal analyses also revealed increases in the proinflammatory CD14+CD16+ monocyte subset in blood following each vaccination (Figure 1F and Supplemental Figure 1B), suggesting that RNActive vaccines rapidly, but transiently, elevate levels of inflammation. Notably, classical CD14+CD16– monocytes transiently decreased while nonclassical CD14–CD16+ monocytes were generally stable after vaccination (Supplemental Figure 1, C and D). Finally, analysis of soluble immune mediators in plasma 24 hours after each vaccination revealed increases in proinflammatory cytokines such as IL-1RA, IP-10, I-TAC, IL-6, and MCP-1 in both vaccine groups (Figure 1G). However, no measurable increase in plasma viral blips above 15 SIV RNA copies/mL was observed in either group after vaccination (Figure 1B). Collectively, these data demonstrate that RNActive vaccines are safe, transiently increase innate immune activation, and do not induce measurable virus reactivation in SIV-infected RMs on ART.
mRNA/SIVgag vaccination increases Gag-specific CD8+ T cells in SIV-infected RM on ART. After vaccination with the mRNA/SIVgag and mRNA/control vaccines, flow cytometric intracellular cytokine staining (ICS) was used to measure the vaccine-elicited CD8+ T cell response to consecutive, overlapping Gag 15-mer peptide pools (Supplemental Figure 2). Longitudinal analysis revealed that SIV-specific CD4+ and CD8+ T cell responses in blood and bronchoalveolar lavage (BAL) fluid (representing an immune effector site) were significantly higher in mRNA/SIVgag-vaccinated RMs compared with mRNA/control-vaccinated animals (P < 0.001 for all comparisons). Gag-specific CD8+ T cell responses in the mRNA/SIVgag group peaked at a mean (+SEM) of 4.1% (+3.2%) and 25% (+4.4%) in blood and BAL, respectively. In comparison, Gag-specific CD4+ T cell responses peaked at a mean (+SEM) of 2.2% (+0.2%) and 9.5% (+1.9%) in blood and BAL, respectively (Figure 2, A–D).
 Figure 2
mRNA/SIVgag vaccination induces robust CD8+ T cell responses in SIV-infected RMs on ART. (A–D) Comparison of SIV Gag–specific T cell responses in RMs from the mRNA/SIVgag group versus the mRNA/control group: CD8+ T cell responses in blood (A) and BAL (B), and CD4+ T cell responses in blood (C) and BAL (D). Data represent mean frequencies (n = 8, +SEM). (E and F) Frequencies of peripheral blood CD8+ T cells specific for SIV Gag-CM9 (E) and Tat-SL8 (F), as determined by MHC-I multimer staining as described in Methods. (G) Comparison of SIV Gag–specific CD8+ T cell responses in PLNs, MLNs, BM, and spleen. Each data point represents an individual RM. Box-and -whisker plots show jittered points, a box from first to third quartiles (IQR), and a line at the median, with whiskers down to the minimum and up to the maximum value. Statistical significance between groups was determined by Wilcoxon’s rank-sum test; P values ≤ 0.05 are indicated.
By design, a subset of 3 RMs in the mRNA/SIVgag vaccine group and 2 RMs in the mRNA/control group expressed the MHC-I allele Mamu A*01, which allowed for the quantification of canonical immunodominant Gag-CM9 and Tat-SL8 epitope-specific CD8+ T cell responses by flow cytometric MHC-I multimer staining (Supplemental Figure 3A). Since the mRNA/SIVgag construct encodes for Gag alone, comparisons could be made between native Tat-SL8 epitope-specific responses (Tat is not included in the vaccine) and Gag-CM9 epitope-specific responses, which should be boosted following vaccination. As shown in Figure 2E, there was a marked increase in the frequencies of Gag-CM9+CD8+ T cells in the blood in response to mRNA/SIVgag vaccination. In contrast, frequencies of Tat-SL8+ T cells did not show substantial changes following vaccination (Figure 2F).
Analyses of CD8+ T cell responses in peripheral lymph nodes (PLNs), mesenteric lymph nodes (MLNs), spleen, and bone marrow (BM) by week 18 after first vaccination also revealed higher frequencies of Gag-specific CD8+ T cell responses in the mRNA/SIVgag group compared with the mRNA/control group (Figure 2G). This was further confirmed by Gag-CM9+ MHC-I multimer staining across several lymphoid tissues in the Mamu A*01+ RMs, which revealed higher frequencies of Gag-specific CD8+ T cells in PLNs, MLNs, spleen, BM, BAL, liver, small intestine, and rectum in mRNA/SIVgag-vaccinated RMs compared with controls (Supplemental Figure 3B). Collectively, these data demonstrate that the mRNA/SIVgag vaccine is highly immunogenic in SIV-infected RMs on ART and induces high frequencies of SIV-specific CD8+ T cells in both blood and lymphoid tissue compartments.
mRNA/SIVgag vaccination increases Gag-specific CD8+ T cells during ATI. To determine whether increasing the frequencies of SIV-specific CD8+ T cells at the time of ART discontinuation can enhance the interception of viral reactivation and rebound, a final boost mRNA/SIVgag vaccination was administered approximately 2 weeks prior to ATI. As expected, there was a marked increase in Gag-specific CD8+ T cells in mRNA/SIVgag-vaccinated RMs that peaked at a mean (+SEM) of 3.9% (+1.3%) and 21% (+2.3%) of CD8+ memory T cells in blood and BAL, respectively, by day 10 after ATI (Figure 3, A and B). Of note, increased frequencies of Gag-specific CD4+ T cell responses were also observed, although they peaked lower at a mean (+SEM) of 1.3% (+0.2%) and 9.4% (+2%) CD4+ memory T cells in blood and BAL, respectively (Figure 3, C and D). However, Gag-specific CD4+ T cell responses in both tissues rapidly declined after vaccination such that by 3 weeks after ART, there was no statistical difference between vaccinated RMs and controls. Flow cytometric tetramer staining of epitope-specific responses in Mamu A*01+ RMs also revealed that the final boost mRNA/SIVgag vaccination increased frequencies of Gag-CM9+CD8+ T cells in blood and BAL during ATI (Figure 3, E and F). In contrast, mRNA/control-vaccinated RMs exhibited a gradual increase in Gag-specific CD8+ T cells in blood and BAL starting approximately 3 weeks after ATI. A similar expansion of Tat-SL8+CD8+ T cells was also observed in mRNA/control-vaccinated RMs after ART discontinuation (Supplemental Figure 4, A and B). Both of these responses were indicative of antigen-driven T cell expansion in response to rebounding viremia.
 Figure 3
A booster mRNA/SIVgag vaccination just prior to ART cessation enhances CD8+ T cell responses during ATI. (A–D) Comparison of SIV Gag–specific CD8+ T cell responses in RMs from the mRNA/SIVgag group versus the mRNA/control group: CD8+ T cell responses in blood (A) and BAL (B), and CD4+ T cell responses in blood (C) and BAL (D). Data represent mean frequencies (n = 8, + SEM). (E and F) Frequencies of peripheral blood CD8+ T cells specific for SIV Gag-CM9 in blood (E) and BAL (F), as determined by MHC-I multimer staining as described in Methods. (G) Comparison of SIV Gag–specific CD8+ T cell responses in lung wash (BAL), blood, PLNs, MLNs, spleen, BM, small intestine, and rectum at 2 time points: 2 days prior to and 18 days after ATI. Each data point represents an individual RM. Box-and-whisker plots show jittered points, a box from first to third quartiles (IQR), and a line at the median, with whiskers down to the minimum and up to the maximum value. Statistical significance between groups was determined by Wilcoxon’s rank-sum test; P values ≤ 0.05 are indicated.
To confirm our objective of systemically increasing Gag-specific CD8+ T cells at the time of ATI, we measured the mRNA vaccine–elicited CD8+ T cell response in several lymphoid tissues, including PLNs, MLNs, spleen, BM, liver, small intestine, and rectum, using ICS. As shown in Figure 3G, mRNA/gag-vaccinated RMs demonstrated statistically significantly higher frequencies of Gag-specific CD8+ T cells in all tissues sampled 2 days before and 18 days after ATI. These data demonstrate that boosting with mRNA/SIVgag vaccination just prior to ATI can substantially enhance CD8+ T cell responses across multiple lymphoid tissue compartments, including mucosal tissue sites that likely contribute to early post-ART viral spread (26).
mRNA/SIVgag vaccination delays time to SIV rebound and enhances early post-ART viral control. We next determined whether these enhanced T cell responses manifested an impact on post-ART viral dynamics. Notably, we observed a substantial delay in the time to measurable rebound viremia in mRNA/SIVgag-vaccinated RMs compared with control vaccinated RMs (Figure 4A). Specifically, viral rebound (defined as the first of 3 consecutive off ART time points > 15 SIV RNA copies/mL) occurred at a median of 20 days after ART in mRNA/SIVgag-vaccinated RMs compared with a median of 11.5 days in controls (P < 0.001, log-rank test). Additionally, fewer SIVmac239M viral barcode clonotypes contributed to post-ART viremia early after ART discontinuation in mRNA/SIVgag-vaccinated RMs compared with controls, though this difference did not reach statistical significance (P = 0.153) (Figure 4B and Supplemental Figure 5). We also determined the growth rate of total plasma SIV RNA and used the proportional representation of individual SIVmac239M barcode clonotypes in relation to total rebound viremia at each time point to estimate the viral reactivation rate in individual RMs, as previously described (27, 28). The average rates of viral barcode clone reactivation were lower in mRNA/gag-vaccinated RMs compared with controls, although this difference also did not reach statistical significance (P = 0.074) (Figure 4C).
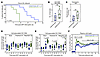 Figure 4
CD8+ T cell responses induced by the mRNA/SIVgag vaccine delay viral rebound and restrict early viral spread. (A) Kaplan-Meier analysis of SIV rebound kinetics in RMs from the mRNA/SIVgag group (n = 8) versus the mRNA/control group (n = 8). (B) Comparison of SIVmac239M proportions and (C) viral barcode clonal reactivation rates in plasma, as determined by high-throughput sequencing following ATI, between the 2 vaccine groups. (D and E) Comparison of SIV DNA (D) and SIV RNA (E) levels in blood, PLNs, and MLNs (copies per 106 cell equivalents) at 2 days prior to and 18 days after ATI. Threshold sensitivity varied as a function of the number of cells available for analysis; for graphing, consistency values are plotted as unfilled symbols with a common nominal sensitivity threshold of 0.06 copies of SIV RNA per 106 cell equivalents, indicated by the gray area. (F) Mean (+SEM) PVL profiles of RMs in the mRNA/SIVgag vaccine group (n = 8) versus the mRNA/control group (n = 8) normalized to rebound. Box-and-whisker plots show jittered points, a box from first to third quartiles (IQR), and a line at the median, with whiskers down to the minimum and up to the maximum value. Statistical significance between groups was determined by Wilcoxon’s rank-sum test; P values ≤ 0.05 are indicated.
The delay in viral rebound and the marginal reductions in both the number of SIVmac239M variants contributing to rebound and their calculated reactivation rates suggest that SIV-specific CD8+ T cell responses induced by mRNA/SIVgag vaccination can provide early restriction of post-ART viral spread. To explore this further, we compared levels of cell-associated SIV DNA and SIV RNA in blood, PLNs, and MLNs between vaccine groups, both 2 days before and 18 days after ART discontinuation. While SIV DNA levels were not significantly different between mRNA/SIVgag-vaccinated RMs and controls before ATI and 18 days after ART (Figure 4D), there was a significant increase in cell-associated SIV RNA levels in PBMCs (P = 0.002), PLNs (P = 0.005), and MLNs (P = 0.007) of mRNA/control-vaccinated RMs by day 18 after ART (Figure 4E), consistent with CD8+ T cell responses in mRNA/SIVgag-vaccinated RMs limiting levels of SIV RNA in tissues after 18 days of ART discontinuation.
Once rebound occurred, there was an early restriction in post-ART viremia, as measured by the AUC of PVL between –1 and 6 weeks following rebound (P = 0.038) in the mRNA/SIVgag group (Figure 4F), suggesting that SIV-specific CD8+ T cell responses induced by mRNA/SIVgag were effective at limiting levels of SIV replication early after ATI. However, this was not sufficient to induce durable post-ART viral control as PVL gradually increased in the mRNA/SIVgag vaccine group, such that by 6–21 weeks after ART, levels of SIV RNA in plasma were not significantly different between the 2 vaccine groups.
Collectively, these data demonstrate the potency of CD8+ T cells against the initial stages of post-ART SIV rebound. As shown in Figure 5A, SIV rebound was restricted in the mRNA/gag vaccine group as SIV-specific CD8+ T cell responses peaked after vaccination. However, as these responses declined from peak in both blood and BAL, mRNA/SIVgag-vaccinated RMs began to manifest increases in plasma viremia. In contrast, SIV rebound in the mRNA/control group preceded the expansion of SIV-specific CD8+ T cell responses (Figure 5B). However, despite evidence of early virologic control, mRNA/SIVgag vaccination alone was not sufficient to facilitate durable virologic control. Full genome sequencing of plasma SIV from a subset of mRNA/SIVgag-vaccinated RMs with high post-ART viremia revealed an accumulation of point mutations across several epitopes, consistent with immune pressure (Supplemental Figure 6). However, while 2 RMs exhibited escape mutations in the putative Gag241-249 CD8+ T cell epitope (29), the other 2 showed no fixed mutations in Gag. These findings suggest that the lack of durable control in mRNA/SIVgag-vaccinated RMs was not invariably due to escape from Gag-specific CD8+ T cell responses induced by vaccination.
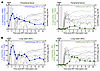 Figure 5
SIV rebound in mRNA/SIVgag-vaccinated RMs coincided with a decline in Gag-specific CD8+ T cells. (A) Overlay of the average frequency (n = 8, +SEM) of SIV Gag–specific CD8+ T cell responses in blood with individual SIV PVL profiles of RMs in the mRNA/SIVgag group (left) and the mRNA/control group (right). (B) A similar overlay is used for the responses in BAL.
mRNA/SIVgag/nef/pol vaccination also delays time to SIV rebound but results in limited enhancement of post-ART viral control. We next determined whether post-ART viral control could be enhanced by broadening the vaccine-induced CD8+ T cell response to include Nef and Pol, in addition to Gag. To test this, we constructed 2 additional vaccines that expressed full-length SIVmac239 Nef (mRNA/SIVnef) and Pol (mRNA/SIVpol). The study involved 10 RMs, which were intravenously inoculated with 5,000 IU of SIVmac239M, followed by ART consisting of tenofovir disoproxil fumarate, emtricitabine, and dolutegravir starting at 9 dpi (Figure 6A). After stable ART suppression for approximately 33 weeks, the RMs were divided into 2 groups (Supplemental Table 2). These groups received 5 intramuscular injections of mRNA/SIVgag + mRNA/SIVnef + mRNA/SIVpol (mRNA/SIVgag/nef/pol; n = 5) at 100 μg each (300 μg total) or no treatment (n = 5) at 34, 37, 40, 54, and 68 wpi, with the final immunization occurring 2 weeks prior to ART discontinuation at 70 wpi.
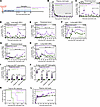 Figure 6
Combining mRNA/SIVgag with Nef and Pol vaccines delays SIV rebound but does not improve early post-ART viral control. (A) Schematic representation of the study protocol including SIVmac239 infection, initiation of ART at 9 dpi, mRNA/SIVgag/nef/pol vaccines, or no vaccination at 239, 260, 281, 379, and 476 dpi. (B) Mean (+SEM) PVL profiles of RMs in the mRNA/SIVgag/nef/pol group (n = 5) versus untreated controls (n = 5) prior to ATI. (C and D) Comparison of total SIV-specific CD8+ T cell responses (sum of Gag, Nef, and Pol) in blood (C) and BAL (D) during ART. (E and F) Total SIV-specific CD8+ T cell responses in blood (E) and BAL (F). (G and H) Total SIV-specific CD4+ T cell responses in blood (G) and BAL (H) during ATI. Data represent mean frequencies (n = 5, +SEM). (I and J) Comparison of SIV Gag–specific CD8+ T cell responses in BAL, blood, PLNs, and BM at 2 days prior to (I) and 18 days after (J) ATI. Each data point represents an individual RM. Box-and-whisker plots show jittered points, a box from first to third quartiles (IQR), and a line at the median, with whiskers down to the minimum and up to the maximum value. (K) Kaplan-Meier analysis of SIV rebound kinetics in the mRNA/SIVgag/nef/pol group versus controls (n = 5 per group). (L) Mean (+SEM) PVL profiles of RMs in both groups following ATI. Statistical significance between groups was determined by Wilcoxon’s rank-sum test; P values ≤ 0.05 are indicated.
In response to ART, PVL declined to below 15 SIV RNA copies/mL by 9 wpi (Figure 6B). After vaccination with the mRNA/SIVgag/nef/pol vectors, flow cytometric ICS was used to measure the vaccine-elicited CD8+ T cell response to Gag, Nef, and Pol peptide pools. Longitudinal analysis revealed that total SIV-specific CD8+ T cell responses (summed across Gag, Nef, and Pol) were significantly higher in blood (P = 0.016) and BAL (P = 0.008) of mRNA/SIVgag/nef/pol-vaccinated RMs compared with unvaccinated controls (Figure 6, C and D). Notably, CD8+ T cell responses following vaccination were higher for Gag compared with Nef or Pol. Gag-specific CD8+ T cells peaked at a mean (+SEM) of 2.1% (+0.9%) and 10.2% (+1.8%) in blood and BAL, respectively, compared with a mean (+SEM) of 0.4% (+0.1%) and 5.5% (+1.4%) for Nef and 0.5% (+0.5%) and 2% (+0.2%) for Pol in blood and BAL, respectively (Supplemental Figure 7). A final boost mRNA/SIVgag/nef/pol vaccination was administered approximately 2 weeks prior to ART discontinuation, and as anticipated, there was a significant increase in total SIV-specific CD8+ T cells in both blood (P = 0.016) and BAL (P = 0.008) between vaccinated RMs and controls through the first 3 weeks of ATI (Figure 6, E and F). Gag-specific CD4+ T cell responses were also significantly higher in blood (P = 0.008) but not BAL through the same period (Figure 6, G and H). We also compared vaccine-elicited CD8+ T cell response in tissues both 2 days before and 18 days after ATI and observed significantly higher frequencies of SIV-specific CD8+ T cells in BAL (2 days before ATI, P = 0.008; 18 days after ATI, P = 0.008), PLNs (2 days before ATI, P = 0.016; 18 days after ATI, P = 0.012), and BM (2 days before ATI, P = 0.008; 18 days after ATI, P = 0.008) (Figure 6, I and J).
After 70 weeks of ART administration and 2 weeks following the final mRNA/SIVgag/nef/pol vaccination, ART was discontinued, and viral rebound dynamics were assessed. Similar to the Gag-only vaccine, a significant delay in the time to measurable rebound viremia was observed in mRNA/SIVgag/nef/pol-vaccinated RMs compared with controls. Specifically, viral rebound occurred at a median of 20 days after ART in mRNA/SIVgag/nef/pol-vaccinated RMs compared with a median of 10 days in controls (P = 0.021, log-rank test) (Figure 6K). However, levels of viremia were not significantly different between vaccinated RMs and controls (Figure 6L). Collectively, these data suggest that broadening the CD8+ T cell response at the time of ATI by adding Pol and Nef gene inserts into the mRNA-based vaccination protocol, while sufficient to extend time to viral rebound relative to controls, did not enhance the durability of post-ART viral control.
Addition of mRNA/SIVnef and mRNA/SIVpol diminished SIV-Gag–specific CD8+ T cell responses compared with responses elicited by mRNA/SIVgag alone. Given that the mRNA/SIVgag/nef/pol vaccination did not enhance the effects observed with mRNA/SIVgag alone, we investigated whether this lack of enhancement was related to differences in the magnitude of Gag-specific CD8+ T cell responses following vaccination. To explore this, we compared the frequencies of Gag-specific CD8+ T cells in the blood and BAL of RMs that received either mRNA/SIVgag alone or mRNA/SIVgag in combination with mRNA/SIVnef and mRNA/SIVpol. As shown in Figure 7, A and B, and Supplemental Figure 8, Gag-specific CD8+ T cell responses were significantly higher in the BAL (P = 0.03) of mRNA/SIVgag-vaccinated RMs compared with those vaccinated with mRNA/SIVgag/nef/pol. Furthermore, after the final boost vaccination, the Gag-specific CD8+ T cell frequencies in the BAL of mRNA/SIVgag-vaccinated RMs were significantly higher (P = 0.019), peaking at a mean (+SEM) of 20.1% (+2.3%), compared with a mean (+SEM) of 10.3% (+0.9%) in the mRNA/SIVgag/nef/pol-vaccinated group (Figure 7C). Notably, although Nef- and Pol-specific CD8+ T cell responses in BAL were higher in the mRNA/SIVgag/nef/pol-vaccinated group during ART and after the final boost, the total CD8+ T cell response, calculated as the sum of Gag, Nef, and Pol responses, remained substantially higher in mRNA/SIVgag-vaccinated group (Supplemental Figure 8). However, no differences were observed in the frequencies of Gag-specific CD8+ T cells in the blood between the 2 vaccine groups (Figure 7D). Similarly, Gag-specific CD4+ T cell responses during ATI were not statistically different between groups (Supplemental Figure 9). Binding antibody responses to recombinant SIV Gag (p27) also showed no substantial differences between groups, either following vaccination or during ATI (Supplemental Figure 10), suggesting that B cell responses were not markedly perturbed.
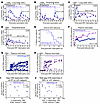 Figure 7
The addition of Nef and Pol vaccines reduced the magnitude of Gag-specific CD8+ T cell responses induced by the mRNA/SIVgag vaccine. (A and B) Comparison of SIV Gag–specific CD8+ T cell responses in BAL (A) and blood (B) of RMs in the mRNA/SIVgag group (n = 8) versus the mRNA/SIVgag/nef/pol group (n = 5) during ART. (C and D) SIV Gag–specific CD8+ T cell responses in BAL (C) and blood (D) of RMs in the same groups during ATI. Data represent mean frequencies (+SEM). (E) Kaplan-Meier analysis of SIV rebound kinetics in the mRNA/SIVgag group versus the mRNA/SIVgag/nef/pol group. (F) Mean (+SEM) PVL profiles of RMs in both groups following ATI. (G and H) Individual PVL trajectories of RM in each vaccine group after ATI. (I) Scatterplots of Gag-specific CD8+ T cell responses in BAL at the time of ATI versus PVL 24 weeks after ATI. (J) Scatterplots of total Gag-specific CD8+ T cell responses in BAL (measured from 0 to 34 weeks after the first vaccination) versus PVL 24 weeks after ATI. Statistical comparisons between vaccine groups were performed using Wilcoxon’s rank-sum test; P values ≤ 0.05 are indicated. Spearman’s rank correlation coefficients (r) with unadjusted P values are shown for scatterplots to assess associations between immune responses and viral loads.
Collectively, these results suggest that the inclusion of additional antigens in the vaccine protocol reduced the Gag-specific CD8+ T cell responses in the BAL (representing an immune effector site) compared with mRNA/SIVgag vaccination by itself. To determine whether this apparent antigenic interference in vaccine responses was specific to Gag, we conducted a pilot study in which a separate cohort of SIV-infected RMs on ART received either mRNA/SIVnef or mRNA/SIVpol (Supplemental Table 3). CD8+ T cell responses to Nef and Pol were then compared with those in animals vaccinated with mRNA/SIVgag/nef/pol. Overall, Nef- and Pol-specific CD8+ T cell responses in BAL were higher in RMs that received mRNA/SIVnef or mRNA/SIVpol alone than in those that received mRNA/SIVgag/nef/pol (Supplemental Figure 11). While the differences in the magnitude of Gag-specific CD8+ T cell responses between both vaccine groups did not have a significant impact on the time to measurable rebound viremia (Figure 7E), post-ART PVLs were higher in the mRNA/SIVgag/nef/pol group compared with the mRNA/SIVgag-only group (Figure 7F). Indeed, by 24 weeks after ART discontinuation, 80% of RMs (4 of 5) in the mRNA/SIVgag/nef/pol group exhibited PVLs > 5 logs compared with 37.5% of RMs (3 of 8) in the mRNA/SIVgag-alone group (Figure 7, G and H). When we explored correlates of post-ART viral control, a significant correlation was found between the magnitude of Gag-specific CD8+ T cells in the BAL, both the total frequencies measured by AUC between 0 and 34 weeks after the first vaccination (P < 0.001) and frequencies at the time of ATI (P = 0.01), and post-ART PVL set points 24 weeks after ATI (Figure 7, I and J). In contrast, there was no correlation between Gag-specific CD4+ T cells and post-ART viral load set points (Supplemental Figure 12). These findings suggest that the magnitude of vaccine-induced, Gag-specific CD8+ T cell responses in a mucosal tissue compartment such as the BAL influenced levels of SIVmac239 RNA in plasma 6 months following ATI.


Copyright © 2026 American Society for Clinical Investigation
ISSN: 0021-9738 (print), 1558-8238 (online)