
Advertisement
Research ArticleAutoimmunityDermatology
Open Access |  10.1172/JCI197665
CD20+ T follicular helper–like cells drive antigen-specific autoimmunity in bullous pemphigoid
Hui Fang,1 Shengxian Shen,1 Kang Li,1 Tianyu Cao,2 Bing Wang,1 Haijun Miao,1 Ke Xue,1 Yaxing Bai,1 Liang Li,1 Xia Li,1 Pei Qiao,1 Jieyu Zhang,1 Huanhuan Qu,1 Chen Zhang,1 Chunying Xiao,1 Bingyu Pang,1 Meng Fu,1 Hongjiang Qiao,1 Shuai Shao,1 Erle Dang,1 and Gang Wang1
1Department of Dermatology, Xijing Hospital, Fourth Military Medical University, Xi’an, Shaanxi, China.
2Department of Dermatology, Tangdu Hospital, Fourth Military Medical University, Xi’an, Shaanxi, China.
Address correspondence to: Gang Wang, Erle Dang, or Shuai Shao, Department of Dermatology, Xijing Hospital, Fourth Military Medical University, 127 Changlexi Road, Xi’an 710032, China. Phone: 86.29.84771244; Email: xjwgang@fmmu.edu.cn (GW); dangerle@fmmu.edu.cn (ED); shaos@fmmu.edu.cn (S Shao).
Authorship note: HF, S Shen, KL, and TC contributed equally to this work.
Find articles by Fang, H. in: PubMed | Google Scholar
1Department of Dermatology, Xijing Hospital, Fourth Military Medical University, Xi’an, Shaanxi, China.
2Department of Dermatology, Tangdu Hospital, Fourth Military Medical University, Xi’an, Shaanxi, China.
Address correspondence to: Gang Wang, Erle Dang, or Shuai Shao, Department of Dermatology, Xijing Hospital, Fourth Military Medical University, 127 Changlexi Road, Xi’an 710032, China. Phone: 86.29.84771244; Email: xjwgang@fmmu.edu.cn (GW); dangerle@fmmu.edu.cn (ED); shaos@fmmu.edu.cn (S Shao).
Authorship note: HF, S Shen, KL, and TC contributed equally to this work.
Find articles by Shen, S. in: PubMed | Google Scholar
1Department of Dermatology, Xijing Hospital, Fourth Military Medical University, Xi’an, Shaanxi, China.
2Department of Dermatology, Tangdu Hospital, Fourth Military Medical University, Xi’an, Shaanxi, China.
Address correspondence to: Gang Wang, Erle Dang, or Shuai Shao, Department of Dermatology, Xijing Hospital, Fourth Military Medical University, 127 Changlexi Road, Xi’an 710032, China. Phone: 86.29.84771244; Email: xjwgang@fmmu.edu.cn (GW); dangerle@fmmu.edu.cn (ED); shaos@fmmu.edu.cn (S Shao).
Authorship note: HF, S Shen, KL, and TC contributed equally to this work.
Find articles by Li, K. in: PubMed | Google Scholar
1Department of Dermatology, Xijing Hospital, Fourth Military Medical University, Xi’an, Shaanxi, China.
2Department of Dermatology, Tangdu Hospital, Fourth Military Medical University, Xi’an, Shaanxi, China.
Address correspondence to: Gang Wang, Erle Dang, or Shuai Shao, Department of Dermatology, Xijing Hospital, Fourth Military Medical University, 127 Changlexi Road, Xi’an 710032, China. Phone: 86.29.84771244; Email: xjwgang@fmmu.edu.cn (GW); dangerle@fmmu.edu.cn (ED); shaos@fmmu.edu.cn (S Shao).
Authorship note: HF, S Shen, KL, and TC contributed equally to this work.
Find articles by Cao, T. in: PubMed | Google Scholar
1Department of Dermatology, Xijing Hospital, Fourth Military Medical University, Xi’an, Shaanxi, China.
2Department of Dermatology, Tangdu Hospital, Fourth Military Medical University, Xi’an, Shaanxi, China.
Address correspondence to: Gang Wang, Erle Dang, or Shuai Shao, Department of Dermatology, Xijing Hospital, Fourth Military Medical University, 127 Changlexi Road, Xi’an 710032, China. Phone: 86.29.84771244; Email: xjwgang@fmmu.edu.cn (GW); dangerle@fmmu.edu.cn (ED); shaos@fmmu.edu.cn (S Shao).
Authorship note: HF, S Shen, KL, and TC contributed equally to this work.
Find articles by Wang, B. in: PubMed | Google Scholar
1Department of Dermatology, Xijing Hospital, Fourth Military Medical University, Xi’an, Shaanxi, China.
2Department of Dermatology, Tangdu Hospital, Fourth Military Medical University, Xi’an, Shaanxi, China.
Address correspondence to: Gang Wang, Erle Dang, or Shuai Shao, Department of Dermatology, Xijing Hospital, Fourth Military Medical University, 127 Changlexi Road, Xi’an 710032, China. Phone: 86.29.84771244; Email: xjwgang@fmmu.edu.cn (GW); dangerle@fmmu.edu.cn (ED); shaos@fmmu.edu.cn (S Shao).
Authorship note: HF, S Shen, KL, and TC contributed equally to this work.
Find articles by Miao, H. in: PubMed | Google Scholar
1Department of Dermatology, Xijing Hospital, Fourth Military Medical University, Xi’an, Shaanxi, China.
2Department of Dermatology, Tangdu Hospital, Fourth Military Medical University, Xi’an, Shaanxi, China.
Address correspondence to: Gang Wang, Erle Dang, or Shuai Shao, Department of Dermatology, Xijing Hospital, Fourth Military Medical University, 127 Changlexi Road, Xi’an 710032, China. Phone: 86.29.84771244; Email: xjwgang@fmmu.edu.cn (GW); dangerle@fmmu.edu.cn (ED); shaos@fmmu.edu.cn (S Shao).
Authorship note: HF, S Shen, KL, and TC contributed equally to this work.
Find articles by Xue, K. in: PubMed | Google Scholar
1Department of Dermatology, Xijing Hospital, Fourth Military Medical University, Xi’an, Shaanxi, China.
2Department of Dermatology, Tangdu Hospital, Fourth Military Medical University, Xi’an, Shaanxi, China.
Address correspondence to: Gang Wang, Erle Dang, or Shuai Shao, Department of Dermatology, Xijing Hospital, Fourth Military Medical University, 127 Changlexi Road, Xi’an 710032, China. Phone: 86.29.84771244; Email: xjwgang@fmmu.edu.cn (GW); dangerle@fmmu.edu.cn (ED); shaos@fmmu.edu.cn (S Shao).
Authorship note: HF, S Shen, KL, and TC contributed equally to this work.
Find articles by
Bai, Y.
in:
PubMed
|
Google Scholar
|

1Department of Dermatology, Xijing Hospital, Fourth Military Medical University, Xi’an, Shaanxi, China.
2Department of Dermatology, Tangdu Hospital, Fourth Military Medical University, Xi’an, Shaanxi, China.
Address correspondence to: Gang Wang, Erle Dang, or Shuai Shao, Department of Dermatology, Xijing Hospital, Fourth Military Medical University, 127 Changlexi Road, Xi’an 710032, China. Phone: 86.29.84771244; Email: xjwgang@fmmu.edu.cn (GW); dangerle@fmmu.edu.cn (ED); shaos@fmmu.edu.cn (S Shao).
Authorship note: HF, S Shen, KL, and TC contributed equally to this work.
Find articles by Li, L. in: PubMed | Google Scholar
1Department of Dermatology, Xijing Hospital, Fourth Military Medical University, Xi’an, Shaanxi, China.
2Department of Dermatology, Tangdu Hospital, Fourth Military Medical University, Xi’an, Shaanxi, China.
Address correspondence to: Gang Wang, Erle Dang, or Shuai Shao, Department of Dermatology, Xijing Hospital, Fourth Military Medical University, 127 Changlexi Road, Xi’an 710032, China. Phone: 86.29.84771244; Email: xjwgang@fmmu.edu.cn (GW); dangerle@fmmu.edu.cn (ED); shaos@fmmu.edu.cn (S Shao).
Authorship note: HF, S Shen, KL, and TC contributed equally to this work.
Find articles by Li, X. in: PubMed | Google Scholar
1Department of Dermatology, Xijing Hospital, Fourth Military Medical University, Xi’an, Shaanxi, China.
2Department of Dermatology, Tangdu Hospital, Fourth Military Medical University, Xi’an, Shaanxi, China.
Address correspondence to: Gang Wang, Erle Dang, or Shuai Shao, Department of Dermatology, Xijing Hospital, Fourth Military Medical University, 127 Changlexi Road, Xi’an 710032, China. Phone: 86.29.84771244; Email: xjwgang@fmmu.edu.cn (GW); dangerle@fmmu.edu.cn (ED); shaos@fmmu.edu.cn (S Shao).
Authorship note: HF, S Shen, KL, and TC contributed equally to this work.
Find articles by Qiao, P. in: PubMed | Google Scholar
1Department of Dermatology, Xijing Hospital, Fourth Military Medical University, Xi’an, Shaanxi, China.
2Department of Dermatology, Tangdu Hospital, Fourth Military Medical University, Xi’an, Shaanxi, China.
Address correspondence to: Gang Wang, Erle Dang, or Shuai Shao, Department of Dermatology, Xijing Hospital, Fourth Military Medical University, 127 Changlexi Road, Xi’an 710032, China. Phone: 86.29.84771244; Email: xjwgang@fmmu.edu.cn (GW); dangerle@fmmu.edu.cn (ED); shaos@fmmu.edu.cn (S Shao).
Authorship note: HF, S Shen, KL, and TC contributed equally to this work.
Find articles by Zhang, J. in: PubMed | Google Scholar
1Department of Dermatology, Xijing Hospital, Fourth Military Medical University, Xi’an, Shaanxi, China.
2Department of Dermatology, Tangdu Hospital, Fourth Military Medical University, Xi’an, Shaanxi, China.
Address correspondence to: Gang Wang, Erle Dang, or Shuai Shao, Department of Dermatology, Xijing Hospital, Fourth Military Medical University, 127 Changlexi Road, Xi’an 710032, China. Phone: 86.29.84771244; Email: xjwgang@fmmu.edu.cn (GW); dangerle@fmmu.edu.cn (ED); shaos@fmmu.edu.cn (S Shao).
Authorship note: HF, S Shen, KL, and TC contributed equally to this work.
Find articles by Qu, H. in: PubMed | Google Scholar
1Department of Dermatology, Xijing Hospital, Fourth Military Medical University, Xi’an, Shaanxi, China.
2Department of Dermatology, Tangdu Hospital, Fourth Military Medical University, Xi’an, Shaanxi, China.
Address correspondence to: Gang Wang, Erle Dang, or Shuai Shao, Department of Dermatology, Xijing Hospital, Fourth Military Medical University, 127 Changlexi Road, Xi’an 710032, China. Phone: 86.29.84771244; Email: xjwgang@fmmu.edu.cn (GW); dangerle@fmmu.edu.cn (ED); shaos@fmmu.edu.cn (S Shao).
Authorship note: HF, S Shen, KL, and TC contributed equally to this work.
Find articles by Zhang, C. in: PubMed | Google Scholar
1Department of Dermatology, Xijing Hospital, Fourth Military Medical University, Xi’an, Shaanxi, China.
2Department of Dermatology, Tangdu Hospital, Fourth Military Medical University, Xi’an, Shaanxi, China.
Address correspondence to: Gang Wang, Erle Dang, or Shuai Shao, Department of Dermatology, Xijing Hospital, Fourth Military Medical University, 127 Changlexi Road, Xi’an 710032, China. Phone: 86.29.84771244; Email: xjwgang@fmmu.edu.cn (GW); dangerle@fmmu.edu.cn (ED); shaos@fmmu.edu.cn (S Shao).
Authorship note: HF, S Shen, KL, and TC contributed equally to this work.
Find articles by Xiao, C. in: PubMed | Google Scholar
1Department of Dermatology, Xijing Hospital, Fourth Military Medical University, Xi’an, Shaanxi, China.
2Department of Dermatology, Tangdu Hospital, Fourth Military Medical University, Xi’an, Shaanxi, China.
Address correspondence to: Gang Wang, Erle Dang, or Shuai Shao, Department of Dermatology, Xijing Hospital, Fourth Military Medical University, 127 Changlexi Road, Xi’an 710032, China. Phone: 86.29.84771244; Email: xjwgang@fmmu.edu.cn (GW); dangerle@fmmu.edu.cn (ED); shaos@fmmu.edu.cn (S Shao).
Authorship note: HF, S Shen, KL, and TC contributed equally to this work.
Find articles by Pang, B. in: PubMed | Google Scholar
1Department of Dermatology, Xijing Hospital, Fourth Military Medical University, Xi’an, Shaanxi, China.
2Department of Dermatology, Tangdu Hospital, Fourth Military Medical University, Xi’an, Shaanxi, China.
Address correspondence to: Gang Wang, Erle Dang, or Shuai Shao, Department of Dermatology, Xijing Hospital, Fourth Military Medical University, 127 Changlexi Road, Xi’an 710032, China. Phone: 86.29.84771244; Email: xjwgang@fmmu.edu.cn (GW); dangerle@fmmu.edu.cn (ED); shaos@fmmu.edu.cn (S Shao).
Authorship note: HF, S Shen, KL, and TC contributed equally to this work.
Find articles by Fu, M. in: PubMed | Google Scholar
1Department of Dermatology, Xijing Hospital, Fourth Military Medical University, Xi’an, Shaanxi, China.
2Department of Dermatology, Tangdu Hospital, Fourth Military Medical University, Xi’an, Shaanxi, China.
Address correspondence to: Gang Wang, Erle Dang, or Shuai Shao, Department of Dermatology, Xijing Hospital, Fourth Military Medical University, 127 Changlexi Road, Xi’an 710032, China. Phone: 86.29.84771244; Email: xjwgang@fmmu.edu.cn (GW); dangerle@fmmu.edu.cn (ED); shaos@fmmu.edu.cn (S Shao).
Authorship note: HF, S Shen, KL, and TC contributed equally to this work.
Find articles by Qiao, H. in: PubMed | Google Scholar
1Department of Dermatology, Xijing Hospital, Fourth Military Medical University, Xi’an, Shaanxi, China.
2Department of Dermatology, Tangdu Hospital, Fourth Military Medical University, Xi’an, Shaanxi, China.
Address correspondence to: Gang Wang, Erle Dang, or Shuai Shao, Department of Dermatology, Xijing Hospital, Fourth Military Medical University, 127 Changlexi Road, Xi’an 710032, China. Phone: 86.29.84771244; Email: xjwgang@fmmu.edu.cn (GW); dangerle@fmmu.edu.cn (ED); shaos@fmmu.edu.cn (S Shao).
Authorship note: HF, S Shen, KL, and TC contributed equally to this work.
Find articles by
Shao, S.
in:
PubMed
|
Google Scholar
|
1Department of Dermatology, Xijing Hospital, Fourth Military Medical University, Xi’an, Shaanxi, China.
2Department of Dermatology, Tangdu Hospital, Fourth Military Medical University, Xi’an, Shaanxi, China.
Address correspondence to: Gang Wang, Erle Dang, or Shuai Shao, Department of Dermatology, Xijing Hospital, Fourth Military Medical University, 127 Changlexi Road, Xi’an 710032, China. Phone: 86.29.84771244; Email: xjwgang@fmmu.edu.cn (GW); dangerle@fmmu.edu.cn (ED); shaos@fmmu.edu.cn (S Shao).
Authorship note: HF, S Shen, KL, and TC contributed equally to this work.
Find articles by
Dang, E.
in:
PubMed
|
Google Scholar
|
1Department of Dermatology, Xijing Hospital, Fourth Military Medical University, Xi’an, Shaanxi, China.
2Department of Dermatology, Tangdu Hospital, Fourth Military Medical University, Xi’an, Shaanxi, China.
Address correspondence to: Gang Wang, Erle Dang, or Shuai Shao, Department of Dermatology, Xijing Hospital, Fourth Military Medical University, 127 Changlexi Road, Xi’an 710032, China. Phone: 86.29.84771244; Email: xjwgang@fmmu.edu.cn (GW); dangerle@fmmu.edu.cn (ED); shaos@fmmu.edu.cn (S Shao).
Authorship note: HF, S Shen, KL, and TC contributed equally to this work.
Find articles by
Wang, G.
in:
PubMed
|
Google Scholar
|
Published July 7, 2026 - More info
J Clin Invest. 2026;136(17):e197665. https://doi.org/10.1172/JCI197665.
© 2026 Fang et al. This work is licensed under the Creative Commons Attribution 4.0 International License. To view a copy of this license, visit http://creativecommons.org/licenses/by/4.0/.
Received: July 25, 2025; Accepted: July 2, 2026


-
Results
CD20+ T cells expand in the peripheral blood and skin lesions of patients with BP. To explore the potential involvement of CD3+CD20+ T cells in BP pathogenesis, we compared their levels in patients with BP and sex- and age-matched healthy controls via flow cytometry. Our analyses revealed significantly higher percentages of CD3+CD20+ T cells in the peripheral blood of patients with BP than in that of healthy controls (Figure 1, A and B). Additionally, the frequencies of these CD20+ T cells were significantly positively correlated with the serum titer of anti–BP180-NC16A IgG, a key biomarker of disease severity (Figure 1C). Previous studies have shown that CD20+ T cells encompass both CD4+ and CD8+ subpopulations (3). Our analysis of gated CD3+CD20+ T cells in the circulation revealed an increase in the CD4+CD20+ T cell subpopulation in patients with BP compared with healthy controls, though the difference was not statistically significant (Supplemental Figure 1, A and B; supplemental material available online with this article; https://doi.org/10.1172/JCI197665DS1). After corticosteroid treatment, which is typically the initial therapy for BP, there was no significant change in the overall frequency of CD3+CD20+ T cells (Supplemental Figure 1, C and D). However, we observed a shift in the CD4+ and CD8+ subpopulations within CD20+ T cells after corticosteroid treatment: the proportion of CD4+CD20+ T cells decreased, whereas that of CD8+CD20+ T cells increased (Figure 1D and Supplemental Figure 1, D and E).
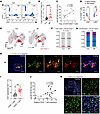 Figure 1
Increased levels of CD20+ T cells in patients with BP. (A) Representative flow cytometry dot plot showing CD3+CD20+ T cell identification in peripheral blood. (B) Frequencies of CD3+CD20+ T cells in PBMCs from healthy controls (Con; n = 15) and patients with BP (n = 15). (C) Correlation between the proportions of circulating CD3+CD20+ T cells and serum anti–BP180-NC16A antibody titers in patients with BP (n = 15). (D) Frequencies of CD4+CD20+ and CD8+CD20+ T cells before and after glucocorticoid treatment in patients with BP (n = 6). (E) Uniform manifold approximation and projection (UMAP) visualization of CD3+CD20+ T cells and subsets (CD4+ and CD8+) in Con and Patients with BP. (F) Bar charts showing the proportions of CD3+CD20+ T cells in Con and patients with BP. (G) Bar charts showing the proportions of CD4+CD20+ and CD8+CD20+ T cells in Con and patients with BP. (H) Representative images of immunofluorescence staining for CD3 (yellow), CD19 (green), CD20 (red), and DNA (Hoechst, blue) in the skin lesions of patients with BP. Scale bar = 100 μm; scale bar inset = 50 μm. (I) Relative proportions of CD3+CD20+ and CD3+CD20– T cells in the skin lesions of individual patients with BP (n = 21). (J) Correlation between the relative proportions of CD3+CD20+ T cells in skin lesions and anti–BP180-NC16A antibody titers in patients with BP (n = 21). (K) Representative images of immunofluorescence staining for CD4 (yellow), CD8 (red), CD20 (green), and DNA (Hoechst, blue) in BP skin lesions (n = 8). Scale bar = 100 μm; scale bar inset = 50 μm. All data are presented as the mean ± SD. An unpaired 2-tailed Student’s t test was used for B and I; Spearman’s correlation was used for C and J; χ2 test was used for F and G; a paired Student’s t test was used for D. *P < 0.05, **P < 0.01, ****P < 0.0001.
To further investigate the circulating immunological changes in BP, we performed single-cell RNA sequencing (scRNA-seq) on immune cells isolated from 3 patients with active BP and 3 age- and sex-matched healthy controls (Supplemental Figure 2, A and B). Following quality control, a total of 52,794 high-quality cells (25,073 from healthy controls and 27,721 from BP patients) were used for further analysis. Using a standard single-cell analysis pipeline, we identified 15 distinct clusters (Supplemental Figure 2C). On the basis of canonical marker gene expression, these clusters were classified into 7 major immune cell types: T cells, B cells, natural killer (NK) cells, monocytes, granulocytes, megakaryocytes, and dendritic cells (Supplemental Figure 2, D and E). Comparative analysis revealed marked shifts in immune cell proportions, including reduced levels of T cells and NK cells and increased proportions of monocytes and granulocytes, in patients with BP compared with healthy controls (Supplemental Figure 2F). Consistent with the flow cytometry data, our scRNA-seq analysis revealed a T cell subset expressing the classical B cell marker gene MS4A1 in both patients with BP and healthy controls (Figure 1E). Cluster proportion analysis revealed that an increased proportion of CD3+CD20+ T cells was accompanied by a corresponding decrease in CD3+CD20– T cells in BP (Figure 1F). Quantification revealed that CD8+CD20+ T cells constituted a substantial proportion of T cells in both groups. Strikingly, the proportion of CD4+CD20+ T cells was significantly greater in the BP group than in the healthy control group (Figure 1G).
Next, we investigated whether CD20+ T cells were also present in the inflamed skin tissues of BP and other skin diseases. Confocal imaging revealed the colocalization of CD20 with the classic T cell marker CD3 and the B cell marker CD19, confirming the presence of both CD3+CD20+ T cells and CD19+CD20+ B cells in BP skin lesions (Figure 1H). Interestingly, we also detected the presence of CD3+CD20+ T cells in blister fluid (BF), a body fluid that is specifically enriched with innate and adaptive immune cells in BP (Supplemental Figure 3, A and B). Notably, CD3+CD20+ T cells were absent in lesions from patients with other autoimmune and inflammatory skin conditions, such as pemphigus vulgaris, psoriasis, and lichen planus (Supplemental Figure 3B). Among the CD3+ T cells infiltrating BP lesions, CD3+CD20+ T cells were more prevalent than CD3+CD20– T cells (Figure 1I and Supplemental Figure 4, A and B). Furthermore, the abundance of CD3+CD20+ T cells in skin lesions was positively correlated with the titers of anti-BP180 NC16A antibodies (Figure 1J). Immunofluorescence analysis further demonstrated that CD4+CD20+ T cells, not CD8+CD20+ T cells, constituted the major infiltrating CD20+ T cell subpopulation in BP skin lesions (Figure 1K). Collectively, these results demonstrate that the expansion of CD20+ T cells in the peripheral blood and skin lesions of patients with BP is correlated with disease severity.
CD20+ T cells are the predominant BP180-NC16A antigen-specific T cells with enhanced metabolic and pro-inflammatory activities in BP. To gain deeper insights into the functions and transcriptional profile of CD20+ T cells, we sorted and performed RNA-sequencing (RNA-seq) analysis on CD3+CD20+ T cells, CD3+CD20– T cells, and CD19+ B cells from patients with BP and sex- and age-matched healthy controls (n = 3 per group; sorting strategy shown in Supplemental Figure 5A). Our analysis revealed a total of 2,062 and 2,485 differentially expressed genes (DEGs) (fold-change [FC] ≥ 1.5, P < 0.05) between CD19+ B cells and CD3+CD20+ T cells from patients with BP and healthy controls, respectively (Supplemental Figure 5B). Notably, CD3+CD20+ T cells presented upregulated expression of surface markers such as CD3, CD4, CD5, CD8, and CD28 but downregulated expression of CD40, CD74, CD79A, and CD79B. Importantly, compared with CD19+ B cells, CD20+ T cells did not express CD19, CD86, or CD22, suggesting their lineage-specific differences from B cells (Supplemental Figure 5C).
By comparing CD3+CD20+ T cells and CD3+CD20– T cells between patients with BP and healthy controls, we identified 752 upregulated and 305 downregulated genes between CD3+CD20+ T cells and CD3+CD20– T cells from patients with BP. In healthy controls, compared with CD3+CD20– T cells, CD3+CD20+ T cells presented 357 upregulated genes and 275 downregulated genes (Figure 2A). In patients, CD3+CD20+ T cells presented elevated expression levels of genes associated with various biological functions, including cell proliferation (e.g., MKI67), cytokine and chemokine production (e.g., IL15, CXCL8, CCL3), granular protease activity (e.g., GZMK), metabolic processes (e.g., ALG9, GCNT1, ADPRH), epigenetic modifications (e.g., LCMT1), transporters (e.g., SLC39A7), and voltage-gated calcium channels (e.g., CACNA1D), compared with CD3+CD20– T cells (Figure 2B). Gene ontology (GO) analysis further demonstrated enrichment of pathways related to S-adenosyl-l-methionine binding, cytokine production involved in the immune response, glycolipid metabolic processes, and cellular calcium ion homeostasis in CD20+ T cells from both BP and healthy controls (Figure 2C). Consistent with these findings, gene set enrichment analysis (GSEA) showed statistically significant enrichment of genes associated with the inflammatory response and calcium-mediated signaling in CD20+ T cells compared with those in CD20– T cells (Figure 2D). Among all the upregulated genes, Kyoto Encyclopedia of Genes and Genomes (KEGG) analysis revealed enrichment of metabolic pathways, such as glyoxylate and dicarboxylate metabolism, carbon metabolism, pyruvate metabolism, and cholesterol metabolism, specifically in BP CD20+ T cells, underscoring their heightened metabolic activity under disease conditions (Figure 2E).
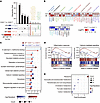 Figure 2
RNA-sequencing analysis of CD20+ T cells in the peripheral blood of humans. CD3+CD20+ T cells, and CD3+CD20– T cells were sorted from 3 patients with BP and 3 sex- and age-matched Con. (A) UpSet plot showing the overlap of differentially expressed genes (DEGs; upregulated and downregulated) between CD20+ T and CD20– T cells in Con and patients with BP. (B) Heatmap of DEGs between CD20+ T cells and CD20– T cells from Con and patients with BP. (C) Gene Ontology (GO) enrichment analysis of DEGs between CD20+ and CD20– T cells in patients with BP and Con. (D) Gene set enrichment analysis (GSEA) showing enrichment of gene sets associated with inflammatory response and calcium-mediated signaling in CD20+ T cells. (E) Kyoto Encyclopedia of Genes and Genomes (KEGG) pathway enrichment of DEGs between CD20+ T cells from patients with BP and those from Con. *P < 0.05, **P < 0.01. DESeq2 with Wald test was used for differential expression analysis in B.
To assess the functional responsiveness of CD20+ T cells to BP autoantigens, we compared the proliferative and cytokine responses of CD20+ and CD20– T cell subsets following stimulation with BP180-NC16A peptides. We found that compared with CD20– T cells, CD20+ T cells displayed increased proliferative capacity when stimulated with peptides in vitro (Figure 3A and Supplemental Figure 6A). Previous research has highlighted the pro-inflammatory role of CD20+ T cells, which produce cytokines such as IFN-γ and TNF-α in diverse autoimmune contexts (4, 22). Notably, intracellular staining showed that the CD20+ T cells produced significant amounts of IFN-γ, IL-4, and IL-17 with or without peptide stimulation when compared with CD20– T cells, suggesting the enhanced pro-inflammatory abilities of CD20+ T cells in BP (Figure 3B and Supplemental Figure 6B). We also found that stimulation of T cells with anti-CD3/CD28 Dynabeads for 72 hours increased CD20 expression, suggesting that TCR activation promotes CD20 upregulation in T cells (Supplemental Figure 7, A–D).
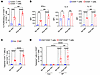 Figure 3
CD20+ T cells exhibit antigen-specific responses in patients with BP. (A) Percentages of proliferating CD20+ and CD20– T cells from patients with BP with or without peptide stimulation (n = 4). (B) Mean fluorescence intensity (MFI) of IFN-γ, IL-4, and IL-17 expression in CD20+ and CD20– T cells from patients with BP under unstimulated or peptide-stimulated conditions (n = 3). (C) Frequencies of tetramer-positive CD4+ T cells in PBMCs collected from untreated patients with BP (n = 6) and HLA allele-matched healthy controls (n = 6). (D) Frequencies of tetramer-positive T cells within gated CD4+CD20+ and CD4+CD20– T cell subsets from PBMCs of untreated patients with BP (n = 6) and HLA allele-matched healthy controls (n = 6), with or without peptide stimulation. All data are presented as the mean ± SD. Two-way ANOVA with Tukey’s post hoc test was used for A–D. *P < 0.05, **P < 0.01, ***P < 0.001, ****P < 0.0001.
Our previous research identified key HLA-DR–restricted T cell epitopes within BP180-NC16A, such as P5 (501–515 aa: ELERIRRSILPYGDS), which play pivotal roles in BP pathogenesis (16). To further assess the antigen specificity of CD20+ T cells in BP, we developed a peptide-MHC class II (pMHC II) tetramer to detect these cells ex vivo in the peripheral blood of untreated patients with BP and HLA allele-matched healthy controls. Flow cytometry analysis revealed a greater proportion of tetramer-positive CD4+ T cells in patients with BP than in healthy controls under resting conditions (Figure 3C and Supplemental Figure 8A), suggesting prior antigen exposure in BP. Upon stimulation with pooled peptides, the frequency of tetramer-positive CD4+ T cells increased further compared with nonstimulated PBMCs from the same patients (Figure 3C and Supplemental Figure 8A). Notably, when comparing tetramer-positive cells within the CD4+CD20+ and CD4+CD20– subsets, we found a markedly higher frequency of tetramer-positive CD4+CD20+ T cells in patients with BP than in healthy controls, both with and without peptide stimulation (Figure 3D and Supplemental Figure 8B), indicating a greater proportion of antigen-specific T cells among the CD20+ T cells. These findings demonstrate that in BP, antigen-specific T cells are enriched within CD20+ T cells, which exhibit heightened responsiveness to autoantigens and enhanced proliferation and elevated metabolic activity.
CD4+CD20+ T cells exhibit characteristics of Tfh-like cells and produce high levels of IL-21 in BP. To further investigate the functional polarization of CD3+CD20+ T cells in BP, we performed GSEA pathway analysis on this subset. Our bulk RNA-seq data revealed significant enrichment of genes associated with Tfh cell differentiation in CD3+CD20+ cells compared with CD3+CD20– T cells in BP (Figure 4A). Given that Tfh cells are primarily a CD4+ T cell subset, we next performed more detailed analyses of CD4+CD20+ and CD8+CD20+ T cells. ScRNA-seq analysis showed that CD4+CD20+ T cells exhibited higher expression of membrane molecules (e.g., PDCD1, CD40LG, CD69, TNFRSF4), receptors (CCR4, CXCR3), effector molecules (IL4, CCL4, GZMK), and transcription factors (MAF, BCL6, and GATA3) than CD4+CD20– T cells. Compared with CD8+CD20– T cells, CD8+CD20+ T cells displayed higher expression of T cell activation and costimulatory molecules (CD69, TNFRSF9, CD27, PDCD1, ICOS), as well as GZMK (Figure 4B). Consistent with these transcriptional profiles, GO analysis revealed that CD4+CD20+ T cells were enriched in biological processes including B cell activation, T cell migration, T cell differentiation, and regulation of T cell activation, whereas CD8+CD20+ T cells were enriched in functions related to defense response to virus and T cell mediated cytotoxicity (Figure 4C). GSEA further demonstrated significant enrichment of mature B cell differentiation and positive regulation of T cell activation in CD4+CD20+ T cells, whereas T cell mediated cytotoxicity and inflammatory cytokine production were preferentially enriched in CD8+CD20+ T cells (Figure 4D and Supplemental Figure 9).
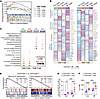 Figure 4
CD4+CD20+ T cells exhibit Tfh-like characteristics in BP. (A) GSEA enrichment plots for hallmark T cell subsets, comparing CD3+CD20+ T cells to CD3+CD20– T cells in patients with BP. (B) ScRNA-seq analysis of CD4+CD20+ and CD8+CD20+ T cells from patients with BP and Con. Heatmap showing DEGs comparing CD4+CD20+ versus CD4+CD20– T cells, and CD8+CD20+ versus CD8+CD20– T cells, between Con and patients with BP. (C) GO analysis of DEGs enriched in the indicated T cell subsets between Con and patients with BP. (D) GSEA showing enrichment of genes related to mature B cell differentiation and positive regulation of T cell activation in CD4+CD20+ T cells. (E) Frequencies of CXCR5+PD-1+ T cells within CD4+CD20+ and CD4+CD20– T cells in Con and patients with BP (n = 6). (F) MFI of IL-21 expression in CD4+CD20+ versus CD4+CD20– T cells from Con and patients with BP (n = 6). All data are presented as the mean ± SD. Two-way ANOVA with Tukey’s post hoc test was used for E and F. ***P < 0.001, ****P < 0.0001.
Next, we examined the secretion of cytokines and proteases by CD4+CD20+ T cells and CD8+CD20+ T cells in healthy controls and patients with BP. Flow cytometry analysis revealed that in both healthy controls and patients with BP, CD4+CD20+ T cells produced higher levels of IL-4, IL-17, and IL-21 compared with CD8+CD20+ T cells. Conversely, CD8+CD20+ T cells from both groups secreted greater amounts of IFN-γ, granzyme B, and perforin than CD4+CD20+ T cells (Supplemental Figure 10, A–L). These data suggest that in BP, CD4+CD20+ T cells are functionally skewed toward B cell help functions and immune activation, whereas CD8+CD20+ T cells display a more cytotoxic and pro-inflammatory profile.
To explore whether CD4+CD20+ T cells exhibit Tfh-like features, we further assessed the expression of CXCR5 and programmed cell death 1 (PD-1), 2 canonical markers associated with Tfh cells. Flow cytometry analysis revealed a greater proportion of CXCR5+PD-1+ cells among CD4+CD20+ T cells than among CD4+CD20– T cells (Figure 4E and Supplemental Figure 11, A and B). Notably, IL-21, a key effector cytokine involved in Tfh-mediated B cell help (23), was expressed at higher levels in CD4+CD20+ T cells from patients with BP than in CD4+CD20– T cells (Figure 4F and Supplemental Figure 11C). Consistent with this phenotype, BCL6 and MAF, 2 transcription factors associated with Tfh-like differentiation, showed higher expression in CD4+CD20+ T cells than in CD4+CD20– T cells in both patients with BP and healthy controls (Supplemental Figure 11, D–G). Finally, immunofluorescence analysis demonstrated colocalization of CD4, CD20, and CXCR5 in BP skin lesions (Supplemental Figure 12), providing in situ evidence that these cells exhibit Tfh-like features within the lesional microenvironment. Together, these data indicate that CD4+CD20+ T cells in BP display a pronounced Tfh-like phenotype characterized by expression of CXCR5, PD-1, BCL6, MAF, and IL-21, supporting their potential role in promoting B cell activation and autoantibody production.
CD4+CD20+ T cells are involved in B cell differentiation and autoantibody production. To further investigate the role of CD20+ T cells in the development of key features associated with BP, we established an active immunization model by immunizing SJL/J mice with a recombinant fragment of murine BP180 (24). Following immunization, all SJL/J mice developed BP180-specific IgG antibodies, which peaked at 4 weeks postimmunization (Figure 5A). Immunofluorescence microscopy confirmed the binding of circulating IgG and complement component C3 to the basement membrane zone, indicating successful induction of BP-specific humoral autoimmunity in this model (Figure 5B). Flow cytometry analysis showed that the frequency of CD3+CD20+ T cells was increased in the spleen, lymph nodes, and peripheral blood of BP180-immunized mice compared with control mice (Supplemental Figure 13, A and B). Among total CD3+ T cells, the frequency of CD4+CD20+ T cells was increased in the spleen and peripheral blood of BP180-immunized mice, whereas the frequency of CD8+CD20+ T cells was not significantly different between the 2 groups (Figure 5C and Supplemental Figure 13, C–E). Furthermore, analysis of the proportions of CD4+ and CD8+ T cells within the CD3+CD20+ T cell population revealed that the proportion of CD4+CD20+ T cells was significantly higher than that of CD8+CD20+ T cells in both control and BP180-immunized mice (Supplemental Figure 14, A and B).
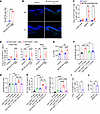 Figure 5
CD20+ T cells are increased in BP180-immunized mice and promote B cell differentiation and antibody production. (A) Serum anti-BP180 antibody titers in control and BP180-immunized mice at week 4, as measured by ELISA (n = 8). (B) Representative direct immunofluorescence images showing IgG and C3 deposition (green) in back skin sections. Scale bar = 100 μm. (C) Frequencies of CD4+CD20+ T cells in the spleen, lymph nodes, and peripheral blood of control and BP180-immunized mice (n = 6). (D) Frequencies of CXCR5+PD-1+ cells among CD4+CD20+ and CD4+CD20– T cells in the spleen, lymph nodes, and peripheral blood of control and BP180-immunized mice (n = 5). (E) MFI of IL-21 in CD4+CD20+ or CD4+CD20– T cells in the spleen of control and BP180-immunized mice (n = 5). (F) Anti-BP180 antibody titers in cell culture supernatants from each group were measured by ELISA (n = 5). (G) Serum anti-BP180 antibody titers in each group of Rag1–/– mice that received adoptive transfer of B cells along with T cell subsets (or B cells alone as control), measured by ELISA (n = 5). (H) Frequencies of GL7+Fas+ germinal center (GC) B cells among B220+ B cells and IgD–CD138+ plasma cells in Rag1–/– recipient mice (n = 5). (I) Frequencies of CXCR5+PD-1+ T cells within CD4+ T cells from negative control–knockout (NC-KO) and MS4A1-knockout (MS4A1-KO) T cells (n = 4). (J) MFI of IL-21 in CD4+ T cells from control and MS4A1-KO T cells (n = 4). All data are presented as the mean ± SD. An unpaired 2-tailed Student’s t test was used for A, C, I, and J; 1-way ANOVA with Tukey’s post hoc test was used for F–H; and 2-way ANOVA with Tukey’s post hoc test was used for D and E. *P < 0.05, **P < 0.01, ***P < 0.001, ****P < 0.0001.
We next examined whether murine CD4+CD20+ T cells displayed Tfh-like features similar to those observed in human BP. Compared with CD4+CD20– T cells, CD4+CD20+ T cells from BP180-immunized mice contained a higher proportion of CXCR5+PD-1+ T cells (Figure 5D and Supplemental Figure 15A). CD4+CD20+ T cells also produced more IL-21 and expressed higher levels of the transcription factors BCL6 and MAF than CD4+CD20– T cells in both control and BP180-immunized mice (Figure 5E and Supplemental Figure 15, B–F). These findings indicate that CD4+CD20+ T cells in the BP180-immunized mouse model exhibit a Tfh-like phenotype resembling that observed in patients with BP.
To further assess the cellular interactions of CD20+ T cells, we analyzed cell-cell communication networks reconstructed from the scRNA-seq dataset. Interactions of CD20+ T cells with dendritic cells, monocytes, NK cells, and B cells were markedly enriched relative to those of CD20– T cells, suggesting that CD20+ T cells are integrated into an immune network that may amplify pathological responses (Supplemental Figure 16). We next directly tested the B cell helper capacity of distinct T cell subsets. The indicated T cell subsets (CD4+CD20+, CD4+CD20–, and CD8+CD20+ T cells) and B220+ B cells were sorted from the spleens and inguinal lymph nodes of BP180-immunized mice and subjected to ex vivo coculture assays. Compared with CD4+CD20– T cells and CD8+CD20+ T cells, CD4+CD20+ T cells more efficiently promoted B cell differentiation into IgD–CD138+ plasma cells and GL7+Fas+ germinal center (GC) B cells, as well as enhanced autoantibody production (Figure 5F and Supplemental Figure 17, A–D).
To determine whether these functional differences were also evident in vivo, we performed adoptive transfer experiments in Rag1–/– mice, which lack mature lymphocytes (Supplemental Figure 18A). ELISA of serum from recipient mice revealed higher levels of anti-BP180 antibodies in those that received CD4+CD20+ T cells and B cells than in those that received other T cell subsets with B cells or B cells alone (Figure 5G). Consistent with these serological findings, analysis of splenocytes revealed increased frequencies of GL7+Fas+ GC B cells and IgD–CD138+ plasma cells in mice receiving CD4+CD20+ T cells plus B cells compared with the other recipient groups (Figure 5H and Supplemental Figure 18, B and C). Importantly, treatment with an IL-21–neutralizing antibody significantly attenuated the capacity of CD4+CD20+ T cells to promote B cell differentiation and antibody production (Figure 5, G and H, and Supplemental Figure 18, B and C), indicating that the pathogenic B cell helper activity of this subset depends, at least in part, on IL-21–mediated Tfh-like effector function. Under these transfer conditions, recipient Rag1–/– mice did not develop overt BP-like blistering, indicating that this system models pathogenic B cell help rather than complete disease recapitulation.
Finally, to explore the functional role of CD20 expression, we isolated primary mouse T cells and generated MS4A1-KO T cells by lentiviral transduction. The proportions of CD3+CD20+ and CD4+CD20+ T cells were reduced in MS4A1-KO T cells (Supplemental Figure 19, A–D). In addition, compared with negative control–KO (NC-KO) T cells, MS4A1-KO T cells showed reduced proportions of CD4+CXCR5+PD-1+ Tfh cells and decreased intracellular IL-21 production (Figure 5, I and J, and Supplemental Figure 19, E and F). These findings demonstrate that CD4+CD20+ T cells are expanded in BP180-immunized mice, exhibit Tfh-like characteristics, and actively promote B cell differentiation and pathogenic antibody production.
Endogenous CD20 expression in human CD20+ T cells is regulated by the transcription factor PAX5. The origin of CD3+CD20+ T cells remains controversial. Some studies have reported that these cells endogenously express CD20 mRNA (MS4A1) (25, 26), whereas others have suggested that CD20 may be acquired from B cells through trogocytosis (4). To address this question, we first examined MS4A1 expression in our bulk RNA-seq dataset. As expected, CD19+ B cells showed high levels of MS4A1 expression, whereas CD20+ T cells expressed low but detectable levels of MS4A1, and CD20– T cells showed little to no expression in both healthy controls and patients with BP (Figure 6A). To further determine whether T cells independently express CD20, we isolated CD20+ T cells, CD20– T cells, and B cells from healthy donors via FACS. Quantitative real-time PCR analysis with 3 MS4A1 primer pairs confirmed that CD20+ T cells exhibited endogenous expression of MS4A1, albeit at lower levels than in B cells (Figure 6, B and C). Furthermore, FISH revealed CD20 signals in a portion of CD3+ T cells from the BP skin lesions (Figure 6D). These results indicate that CD20+ T cells endogenously express CD20.
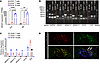 Figure 6
CD20+ T cells exhibit endogenous expression of CD20 in human T cells. (A) RNA-seq of CD19+ B cells, CD3+CD20– T cells, and CD3+CD20+ T cells obtained via FACS to evaluate the CD20-encoding gene MS4A1 (n = 3). FPKM, fragments per kilobase of transcript per million mapped reads. (B) Agarose gel electrophoresis of qPCR products for MS4A1, CD3, and CD19 using cDNA from sorted CD19+ B cells, CD3+CD20– T cells, and CD3+CD20+ T cells. (C) qPCR analysis of MS4A1, CD3, and CD19 expression in sorted CD19+ B cells, CD3+CD20– T cells, and CD3+CD20+ T cells from healthy donor peripheral blood, using 3 independent primer pairs for MS4A1 (MS4A1-1, MS4A1-2, MS4A1-3) (n = 3). (D) Representative RNA in situ hybridization images showing CD3 and CD20 expression in the skin tissue sections of patients with BP (n = 2). Arrows indicate CD3+CD20+ T cells. Scale bar = 100 μm. All data are presented as the mean ± SD. One-way ANOVA with Tukey’s post hoc test was used for A. **P < 0.01, ****P < 0.0001.
To identify regulators of CD20 expression in T cells, we next analyzed transcription factors differentially expressed between CD20+ T cells and CD20– T cells in the bulk RNA-seq dataset. Among the transcription factors enriched in CD20+ T cells, we identified several lineage-associated regulators, including PAX5, TCF3, and ZBTB7B (Figure 7A). We subsequently screened for transcription factors with potential binding affinity for the MS4A1 promoter region. Using de novo sequence motif searches of sequences within the MS4A1 promoter region, we identified motifs resembling the consensus binding sequences for the transcription factor PAX5 (Figure 7B). To confirm the role of PAX5 in regulating MS4A1 expression through its promoter, we conducted a luciferase reporter assay in HEK293T cells. Compared with the wild-type promoter, mutation of the PAX5-binding site significantly reduced luciferase activity, confirming the role of PAX5 in activating MS4A1 expression (Figure 7C). RNA-seq analysis revealed a slight increase in PAX5 mRNA levels in CD20+ T cells compared with CD20– T cells from patients with BP (Figure 7D). Immunofluorescence analysis revealed that peripheral blood B cells strongly expressed both CD20 and PAX5 whereas CD20+ T cells presented lower expression of both proteins, and CD20– T cells did not express PAX5 (Figure 7E). We next asked whether T cell activation could induce the PAX5/CD20 axis. Primary human T cells were isolated and stimulated with anti-CD3/CD28 Dynabeads, and PAX5 expression was monitored over time. Upon stimulation, PAX5 expression increased in a time-dependent manner and peaked at 72 hours after stimulation (Supplemental Figure 20, A and B), consistent with activation-induced engagement of this pathway in T cells.
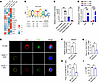 Figure 7
The transcription factor PAX5 regulates endogenous CD20 expression in human CD20+ T cells. (A) Heatmap showing the top differentially expressed transcription factors between CD3+CD20– T cells and CD3+CD20+ T cells. (B) Motifs resembling PAX5-binding motifs within the MS4A1 regulatory region. (C) Luciferase activities of wild-type MS4A1 and MS4A1 with a PAX5–binding site mutation were determined via luciferase reporter assays in HEK293T cells (n = 6). (D) Bulk RNA-seq analysis of PAX5 expression in FACS-sorted CD19+ B cells, CD3+CD20– T cells, and CD3+CD20+ T cells from Con and patients with BP (n = 3). (E) Representative immunofluorescence images showing PAX5 (green), CD3 (red), and CD20 (yellow) in sorted human CD3+CD20+ T cells, CD3+CD20– T cells, and CD19+ B cells (n = 3). Scale bar = 5 μm. (F) PAX5 mRNA expression in NC-KO or PAX5-knockout (PAX5-KO) T cells following activated with anti-CD3/CD28 Dynabeads (n = 4). (G) Frequencies of CD4+CD20+ T cells among control or PAX5-KO T cells (n = 4). (H) Frequencies of CXCR5+PD-1+ T cells within CD4+ T cells among control or PAX5-KO T cells (n = 4). (I) MFI of IL-21 in CD4+ T cells among control or PAX5-KO T cells (n = 4). All data are presented as the mean ± SD. One-way ANOVA with Tukey’s post hoc test was used for D. An unpaired 2-tailed Student’s t test was used for C and F–I. *P < 0.05, **P < 0.01, ***P < 0.001.
Although PAX5 is well known for its role in B cell development (27, 28), its association with MS4A1 regulation in T cells has not been previously described to our knowledge. To more directly test the role of PAX5 in regulating CD20 expression in T cells, we generated PAX5-KO primary human T cells using CRISPR/Cas9 technology and confirmed efficient knockout by qPCR after lentiviral transduction (Supplemental Figure 21A). Loss of PAX5 resulted in a marked reduction in MS4A1 mRNA levels, accompanied by decreased frequencies of total CD20+ T cells as well as CD4+CD20+ and CD8+CD20+ T cell subsets (Figure 7, F and G, and Supplemental Figure 21, B–E), supporting an important role for PAX5 in maintaining CD20 expression in T cells. In addition, PAX5 deficiency was associated with reduced frequencies of CD4+CXCR5+PD-1+ T cells and decreased IL-21 and IFN-γ production relative to NC-KO T cells (Figure 7, H and I, and Supplemental Figure 21, G–J), suggesting that PAX5 also contributes to the maintenance of Tfh-like features in this context. Together, these data support a model in which PAX5 contributes to endogenous CD20 expression in T cells and helps sustain aspects of the Tfh-like program associated with CD20+ T cells.
The differentiation of CD20+ T cells is regulated by DNA methylation. We next examined the impact of PAX5 overexpression on T cell differentiation. Notably, overexpressing PAX5 via lentiviral transduction did not significantly increase MS4A1 mRNA levels (Figure 8A), although the expression levels of PAX5 were 5–10 times higher than those in control cells (Supplemental Figure 22A). Similarly, flow cytometry revealed that PAX5 overexpression did not affect the proportion of CD3+CD20+ T cells (Figure 8B and Supplemental Figure 22B). Therefore, we hypothesized that epigenetic processes may also regulate CD20+ T cell differentiation and function. To investigate whether epigenetic mechanisms contribute to the observed differential expression of CD20, we analyzed DNA methylation patterns in CD20+ T cells and CD20– T cells. We isolated CD3+CD20+ T cells, CD3+CD20– T cells, and CD19+ B cells from 5 healthy donors and conducted amplicon bisulfite sequencing to analyze DNA methylation levels across the MS4A1 gene. The results revealed that differences in methylation levels among these cell populations were primarily attributed to differential methylation in the promoter region of MS4A1 (Figure 8, C and D). Specifically, compared with CD3+CD20+ T cells, CD3+CD20– T cells exhibited higher methylation levels at certain loci within the MS4A1 promoter, such as –82 and +49 relative to the transcription start site (Figure 8E). Given the altered promoter methylation levels observed in CD20+ T cells, we introduced decitabine, a DNA methyltransferase (DNMT) inhibitor, into our coculture system. Our results revealed that DNMT inhibitor treatment increased CD20 expression in T cells overexpressing PAX5 in vitro (Figure 8, F and G, and Supplemental Figure 22C), suggesting that DNA methylation and PAX5 jointly regulate CD20+ T cell development. These findings indicate that DNMT-mediated DNA methylation regulates the differentiation fate of CD20+ T cells.
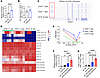 Figure 8
CD20+ T cell differentiation is epigenetically regulated by DNA methylation. (A) MS4A1 mRNA expression in NC and PAX5-overexpressing T cells (PAX5 OE) following activation with anti-CD3/CD28 Dynabeads (n = 6). (B) Frequencies of CD20+ T cells in control and PAX5 OE T cells (n = 6). (C) CD3+CD20+ T cells, CD3+CD20– T cells and B cells were sorted from 5 healthy controls (n = 5). Genome Browser snapshots of the DNA methylation levels of MS4A1 across gene regions in these cells. (D) Heatmap of the CpG methylation status (promoter and exons) at the MS4A1 locus in the same cell populations as in C (n = 5). (E) DNA methylation levels at individual CpG sites within the MS4A1 promoter (positions –303, –82, –29, and +49 relative to the transcription start site) in CD3+CD20+ T cells, CD3+CD20– T cells, and B cells. (F) MS4A1 mRNA expression in control and PAX5 OE T cells treated with or without decitabine (n = 4). (G) Relative frequencies of CD20+ T cells among control and PAX5 OE T cells treated with or without decitabine (n = 4). All data are presented as the mean ± SD. An unpaired 2-tailed Student’s t test was used for A and B; 1-way ANOVA with Tukey’s post hoc test was used for F and G. *P < 0.05, **P < 0.01, ***P < 0.001, ****P < 0.0001.


Copyright © 2026 American Society for Clinical Investigation
ISSN: 0021-9738 (print), 1558-8238 (online)