
Advertisement
Research ArticleCell biologyMetabolismOncology
Open Access |  10.1172/JCI196687
Elevated mitochondrial protein import in acute myeloid leukemia increases reliance on mitochondrial protease LONP1
Matthew Tcheng,1 Veronique Voisin,1 Geethu Emily Thomas,1 Anastasija A. Piric,1 Marcela Gronda,1 Rose Hurren,1 Dakai Ling,1 Yongran Yan,1 Lan Xin Zhang,1 Yue Feng,1 Ali Chegini,1 Nathan Duong,1 Ross S. Mancini,2 Stefan Quinn W. Currie,3 Zaynab Mamai,1 Brady Stock,1 Shahbaz Khan,1 Yulia Jitkova,1 Chaitra Sarathy,1 Edward Ayoub,4 Po Yee Mak,4 Andrea Arruda,1 Thomas Kislinger,1 Mark A. Reed,2,5,6 Bing Z. Carter,4 Michael Andreeff,4 Steven M. Kornblau,4 Mark D. Minden,1 Siavash Vahidi,3 and Aaron D. Schimmer1,7
1Princess Margaret Cancer Centre,
2Krembil Brain Institute, University Health Network, Toronto, Ontario, Canada.
3Department of Molecular and Cell Biology, University of Guelph, Guelph, Ontario, Canada.
4Section of Molecular Hematology and Therapy, Department of Leukemia, The University of Texas MD Anderson Cancer Center, Houston, Texas, USA.
5Department of Pharmacology and Toxicology, and
6Department of Chemistry, University of Toronto, Toronto, Ontario, Canada.
7Ontario Institute for Cancer Research, Toronto, Ontario, Canada.
Address correspondence to: Aaron D. Schimmer, Princess Margaret Cancer Centre, University Health Network, Room 8-706; 101 College St., Toronto, Ontario, Canada M5G 1L7. Phone: 416.946.44501 ext. 3996; Email: Aaron.schimmer@uhn.ca.
Authorship note: MT and VV contributed equally to this work.
Find articles by Tcheng, M. in: PubMed | Google Scholar
1Princess Margaret Cancer Centre,
2Krembil Brain Institute, University Health Network, Toronto, Ontario, Canada.
3Department of Molecular and Cell Biology, University of Guelph, Guelph, Ontario, Canada.
4Section of Molecular Hematology and Therapy, Department of Leukemia, The University of Texas MD Anderson Cancer Center, Houston, Texas, USA.
5Department of Pharmacology and Toxicology, and
6Department of Chemistry, University of Toronto, Toronto, Ontario, Canada.
7Ontario Institute for Cancer Research, Toronto, Ontario, Canada.
Address correspondence to: Aaron D. Schimmer, Princess Margaret Cancer Centre, University Health Network, Room 8-706; 101 College St., Toronto, Ontario, Canada M5G 1L7. Phone: 416.946.44501 ext. 3996; Email: Aaron.schimmer@uhn.ca.
Authorship note: MT and VV contributed equally to this work.
Find articles by Voisin, V. in: PubMed | Google Scholar
1Princess Margaret Cancer Centre,
2Krembil Brain Institute, University Health Network, Toronto, Ontario, Canada.
3Department of Molecular and Cell Biology, University of Guelph, Guelph, Ontario, Canada.
4Section of Molecular Hematology and Therapy, Department of Leukemia, The University of Texas MD Anderson Cancer Center, Houston, Texas, USA.
5Department of Pharmacology and Toxicology, and
6Department of Chemistry, University of Toronto, Toronto, Ontario, Canada.
7Ontario Institute for Cancer Research, Toronto, Ontario, Canada.
Address correspondence to: Aaron D. Schimmer, Princess Margaret Cancer Centre, University Health Network, Room 8-706; 101 College St., Toronto, Ontario, Canada M5G 1L7. Phone: 416.946.44501 ext. 3996; Email: Aaron.schimmer@uhn.ca.
Authorship note: MT and VV contributed equally to this work.
Find articles by Thomas, G. in: PubMed | Google Scholar
1Princess Margaret Cancer Centre,
2Krembil Brain Institute, University Health Network, Toronto, Ontario, Canada.
3Department of Molecular and Cell Biology, University of Guelph, Guelph, Ontario, Canada.
4Section of Molecular Hematology and Therapy, Department of Leukemia, The University of Texas MD Anderson Cancer Center, Houston, Texas, USA.
5Department of Pharmacology and Toxicology, and
6Department of Chemistry, University of Toronto, Toronto, Ontario, Canada.
7Ontario Institute for Cancer Research, Toronto, Ontario, Canada.
Address correspondence to: Aaron D. Schimmer, Princess Margaret Cancer Centre, University Health Network, Room 8-706; 101 College St., Toronto, Ontario, Canada M5G 1L7. Phone: 416.946.44501 ext. 3996; Email: Aaron.schimmer@uhn.ca.
Authorship note: MT and VV contributed equally to this work.
Find articles by Piric, A. in: PubMed | Google Scholar
1Princess Margaret Cancer Centre,
2Krembil Brain Institute, University Health Network, Toronto, Ontario, Canada.
3Department of Molecular and Cell Biology, University of Guelph, Guelph, Ontario, Canada.
4Section of Molecular Hematology and Therapy, Department of Leukemia, The University of Texas MD Anderson Cancer Center, Houston, Texas, USA.
5Department of Pharmacology and Toxicology, and
6Department of Chemistry, University of Toronto, Toronto, Ontario, Canada.
7Ontario Institute for Cancer Research, Toronto, Ontario, Canada.
Address correspondence to: Aaron D. Schimmer, Princess Margaret Cancer Centre, University Health Network, Room 8-706; 101 College St., Toronto, Ontario, Canada M5G 1L7. Phone: 416.946.44501 ext. 3996; Email: Aaron.schimmer@uhn.ca.
Authorship note: MT and VV contributed equally to this work.
Find articles by Gronda, M. in: PubMed | Google Scholar
1Princess Margaret Cancer Centre,
2Krembil Brain Institute, University Health Network, Toronto, Ontario, Canada.
3Department of Molecular and Cell Biology, University of Guelph, Guelph, Ontario, Canada.
4Section of Molecular Hematology and Therapy, Department of Leukemia, The University of Texas MD Anderson Cancer Center, Houston, Texas, USA.
5Department of Pharmacology and Toxicology, and
6Department of Chemistry, University of Toronto, Toronto, Ontario, Canada.
7Ontario Institute for Cancer Research, Toronto, Ontario, Canada.
Address correspondence to: Aaron D. Schimmer, Princess Margaret Cancer Centre, University Health Network, Room 8-706; 101 College St., Toronto, Ontario, Canada M5G 1L7. Phone: 416.946.44501 ext. 3996; Email: Aaron.schimmer@uhn.ca.
Authorship note: MT and VV contributed equally to this work.
Find articles by Hurren, R. in: PubMed | Google Scholar
1Princess Margaret Cancer Centre,
2Krembil Brain Institute, University Health Network, Toronto, Ontario, Canada.
3Department of Molecular and Cell Biology, University of Guelph, Guelph, Ontario, Canada.
4Section of Molecular Hematology and Therapy, Department of Leukemia, The University of Texas MD Anderson Cancer Center, Houston, Texas, USA.
5Department of Pharmacology and Toxicology, and
6Department of Chemistry, University of Toronto, Toronto, Ontario, Canada.
7Ontario Institute for Cancer Research, Toronto, Ontario, Canada.
Address correspondence to: Aaron D. Schimmer, Princess Margaret Cancer Centre, University Health Network, Room 8-706; 101 College St., Toronto, Ontario, Canada M5G 1L7. Phone: 416.946.44501 ext. 3996; Email: Aaron.schimmer@uhn.ca.
Authorship note: MT and VV contributed equally to this work.
Find articles by Ling, D. in: PubMed | Google Scholar
1Princess Margaret Cancer Centre,
2Krembil Brain Institute, University Health Network, Toronto, Ontario, Canada.
3Department of Molecular and Cell Biology, University of Guelph, Guelph, Ontario, Canada.
4Section of Molecular Hematology and Therapy, Department of Leukemia, The University of Texas MD Anderson Cancer Center, Houston, Texas, USA.
5Department of Pharmacology and Toxicology, and
6Department of Chemistry, University of Toronto, Toronto, Ontario, Canada.
7Ontario Institute for Cancer Research, Toronto, Ontario, Canada.
Address correspondence to: Aaron D. Schimmer, Princess Margaret Cancer Centre, University Health Network, Room 8-706; 101 College St., Toronto, Ontario, Canada M5G 1L7. Phone: 416.946.44501 ext. 3996; Email: Aaron.schimmer@uhn.ca.
Authorship note: MT and VV contributed equally to this work.
Find articles by Yan, Y. in: PubMed | Google Scholar
1Princess Margaret Cancer Centre,
2Krembil Brain Institute, University Health Network, Toronto, Ontario, Canada.
3Department of Molecular and Cell Biology, University of Guelph, Guelph, Ontario, Canada.
4Section of Molecular Hematology and Therapy, Department of Leukemia, The University of Texas MD Anderson Cancer Center, Houston, Texas, USA.
5Department of Pharmacology and Toxicology, and
6Department of Chemistry, University of Toronto, Toronto, Ontario, Canada.
7Ontario Institute for Cancer Research, Toronto, Ontario, Canada.
Address correspondence to: Aaron D. Schimmer, Princess Margaret Cancer Centre, University Health Network, Room 8-706; 101 College St., Toronto, Ontario, Canada M5G 1L7. Phone: 416.946.44501 ext. 3996; Email: Aaron.schimmer@uhn.ca.
Authorship note: MT and VV contributed equally to this work.
Find articles by Zhang, L. in: PubMed | Google Scholar
1Princess Margaret Cancer Centre,
2Krembil Brain Institute, University Health Network, Toronto, Ontario, Canada.
3Department of Molecular and Cell Biology, University of Guelph, Guelph, Ontario, Canada.
4Section of Molecular Hematology and Therapy, Department of Leukemia, The University of Texas MD Anderson Cancer Center, Houston, Texas, USA.
5Department of Pharmacology and Toxicology, and
6Department of Chemistry, University of Toronto, Toronto, Ontario, Canada.
7Ontario Institute for Cancer Research, Toronto, Ontario, Canada.
Address correspondence to: Aaron D. Schimmer, Princess Margaret Cancer Centre, University Health Network, Room 8-706; 101 College St., Toronto, Ontario, Canada M5G 1L7. Phone: 416.946.44501 ext. 3996; Email: Aaron.schimmer@uhn.ca.
Authorship note: MT and VV contributed equally to this work.
Find articles by Feng, Y. in: PubMed | Google Scholar
1Princess Margaret Cancer Centre,
2Krembil Brain Institute, University Health Network, Toronto, Ontario, Canada.
3Department of Molecular and Cell Biology, University of Guelph, Guelph, Ontario, Canada.
4Section of Molecular Hematology and Therapy, Department of Leukemia, The University of Texas MD Anderson Cancer Center, Houston, Texas, USA.
5Department of Pharmacology and Toxicology, and
6Department of Chemistry, University of Toronto, Toronto, Ontario, Canada.
7Ontario Institute for Cancer Research, Toronto, Ontario, Canada.
Address correspondence to: Aaron D. Schimmer, Princess Margaret Cancer Centre, University Health Network, Room 8-706; 101 College St., Toronto, Ontario, Canada M5G 1L7. Phone: 416.946.44501 ext. 3996; Email: Aaron.schimmer@uhn.ca.
Authorship note: MT and VV contributed equally to this work.
Find articles by Chegini, A. in: PubMed | Google Scholar
1Princess Margaret Cancer Centre,
2Krembil Brain Institute, University Health Network, Toronto, Ontario, Canada.
3Department of Molecular and Cell Biology, University of Guelph, Guelph, Ontario, Canada.
4Section of Molecular Hematology and Therapy, Department of Leukemia, The University of Texas MD Anderson Cancer Center, Houston, Texas, USA.
5Department of Pharmacology and Toxicology, and
6Department of Chemistry, University of Toronto, Toronto, Ontario, Canada.
7Ontario Institute for Cancer Research, Toronto, Ontario, Canada.
Address correspondence to: Aaron D. Schimmer, Princess Margaret Cancer Centre, University Health Network, Room 8-706; 101 College St., Toronto, Ontario, Canada M5G 1L7. Phone: 416.946.44501 ext. 3996; Email: Aaron.schimmer@uhn.ca.
Authorship note: MT and VV contributed equally to this work.
Find articles by Duong, N. in: PubMed | Google Scholar
1Princess Margaret Cancer Centre,
2Krembil Brain Institute, University Health Network, Toronto, Ontario, Canada.
3Department of Molecular and Cell Biology, University of Guelph, Guelph, Ontario, Canada.
4Section of Molecular Hematology and Therapy, Department of Leukemia, The University of Texas MD Anderson Cancer Center, Houston, Texas, USA.
5Department of Pharmacology and Toxicology, and
6Department of Chemistry, University of Toronto, Toronto, Ontario, Canada.
7Ontario Institute for Cancer Research, Toronto, Ontario, Canada.
Address correspondence to: Aaron D. Schimmer, Princess Margaret Cancer Centre, University Health Network, Room 8-706; 101 College St., Toronto, Ontario, Canada M5G 1L7. Phone: 416.946.44501 ext. 3996; Email: Aaron.schimmer@uhn.ca.
Authorship note: MT and VV contributed equally to this work.
Find articles by Mancini, R. in: PubMed | Google Scholar
1Princess Margaret Cancer Centre,
2Krembil Brain Institute, University Health Network, Toronto, Ontario, Canada.
3Department of Molecular and Cell Biology, University of Guelph, Guelph, Ontario, Canada.
4Section of Molecular Hematology and Therapy, Department of Leukemia, The University of Texas MD Anderson Cancer Center, Houston, Texas, USA.
5Department of Pharmacology and Toxicology, and
6Department of Chemistry, University of Toronto, Toronto, Ontario, Canada.
7Ontario Institute for Cancer Research, Toronto, Ontario, Canada.
Address correspondence to: Aaron D. Schimmer, Princess Margaret Cancer Centre, University Health Network, Room 8-706; 101 College St., Toronto, Ontario, Canada M5G 1L7. Phone: 416.946.44501 ext. 3996; Email: Aaron.schimmer@uhn.ca.
Authorship note: MT and VV contributed equally to this work.
Find articles by Currie, S. in: PubMed | Google Scholar
1Princess Margaret Cancer Centre,
2Krembil Brain Institute, University Health Network, Toronto, Ontario, Canada.
3Department of Molecular and Cell Biology, University of Guelph, Guelph, Ontario, Canada.
4Section of Molecular Hematology and Therapy, Department of Leukemia, The University of Texas MD Anderson Cancer Center, Houston, Texas, USA.
5Department of Pharmacology and Toxicology, and
6Department of Chemistry, University of Toronto, Toronto, Ontario, Canada.
7Ontario Institute for Cancer Research, Toronto, Ontario, Canada.
Address correspondence to: Aaron D. Schimmer, Princess Margaret Cancer Centre, University Health Network, Room 8-706; 101 College St., Toronto, Ontario, Canada M5G 1L7. Phone: 416.946.44501 ext. 3996; Email: Aaron.schimmer@uhn.ca.
Authorship note: MT and VV contributed equally to this work.
Find articles by Mamai, Z. in: PubMed | Google Scholar
1Princess Margaret Cancer Centre,
2Krembil Brain Institute, University Health Network, Toronto, Ontario, Canada.
3Department of Molecular and Cell Biology, University of Guelph, Guelph, Ontario, Canada.
4Section of Molecular Hematology and Therapy, Department of Leukemia, The University of Texas MD Anderson Cancer Center, Houston, Texas, USA.
5Department of Pharmacology and Toxicology, and
6Department of Chemistry, University of Toronto, Toronto, Ontario, Canada.
7Ontario Institute for Cancer Research, Toronto, Ontario, Canada.
Address correspondence to: Aaron D. Schimmer, Princess Margaret Cancer Centre, University Health Network, Room 8-706; 101 College St., Toronto, Ontario, Canada M5G 1L7. Phone: 416.946.44501 ext. 3996; Email: Aaron.schimmer@uhn.ca.
Authorship note: MT and VV contributed equally to this work.
Find articles by Stock, B. in: PubMed | Google Scholar
1Princess Margaret Cancer Centre,
2Krembil Brain Institute, University Health Network, Toronto, Ontario, Canada.
3Department of Molecular and Cell Biology, University of Guelph, Guelph, Ontario, Canada.
4Section of Molecular Hematology and Therapy, Department of Leukemia, The University of Texas MD Anderson Cancer Center, Houston, Texas, USA.
5Department of Pharmacology and Toxicology, and
6Department of Chemistry, University of Toronto, Toronto, Ontario, Canada.
7Ontario Institute for Cancer Research, Toronto, Ontario, Canada.
Address correspondence to: Aaron D. Schimmer, Princess Margaret Cancer Centre, University Health Network, Room 8-706; 101 College St., Toronto, Ontario, Canada M5G 1L7. Phone: 416.946.44501 ext. 3996; Email: Aaron.schimmer@uhn.ca.
Authorship note: MT and VV contributed equally to this work.
Find articles by Khan, S. in: PubMed | Google Scholar
1Princess Margaret Cancer Centre,
2Krembil Brain Institute, University Health Network, Toronto, Ontario, Canada.
3Department of Molecular and Cell Biology, University of Guelph, Guelph, Ontario, Canada.
4Section of Molecular Hematology and Therapy, Department of Leukemia, The University of Texas MD Anderson Cancer Center, Houston, Texas, USA.
5Department of Pharmacology and Toxicology, and
6Department of Chemistry, University of Toronto, Toronto, Ontario, Canada.
7Ontario Institute for Cancer Research, Toronto, Ontario, Canada.
Address correspondence to: Aaron D. Schimmer, Princess Margaret Cancer Centre, University Health Network, Room 8-706; 101 College St., Toronto, Ontario, Canada M5G 1L7. Phone: 416.946.44501 ext. 3996; Email: Aaron.schimmer@uhn.ca.
Authorship note: MT and VV contributed equally to this work.
Find articles by Jitkova, Y. in: PubMed | Google Scholar
1Princess Margaret Cancer Centre,
2Krembil Brain Institute, University Health Network, Toronto, Ontario, Canada.
3Department of Molecular and Cell Biology, University of Guelph, Guelph, Ontario, Canada.
4Section of Molecular Hematology and Therapy, Department of Leukemia, The University of Texas MD Anderson Cancer Center, Houston, Texas, USA.
5Department of Pharmacology and Toxicology, and
6Department of Chemistry, University of Toronto, Toronto, Ontario, Canada.
7Ontario Institute for Cancer Research, Toronto, Ontario, Canada.
Address correspondence to: Aaron D. Schimmer, Princess Margaret Cancer Centre, University Health Network, Room 8-706; 101 College St., Toronto, Ontario, Canada M5G 1L7. Phone: 416.946.44501 ext. 3996; Email: Aaron.schimmer@uhn.ca.
Authorship note: MT and VV contributed equally to this work.
Find articles by Sarathy, C. in: PubMed | Google Scholar
1Princess Margaret Cancer Centre,
2Krembil Brain Institute, University Health Network, Toronto, Ontario, Canada.
3Department of Molecular and Cell Biology, University of Guelph, Guelph, Ontario, Canada.
4Section of Molecular Hematology and Therapy, Department of Leukemia, The University of Texas MD Anderson Cancer Center, Houston, Texas, USA.
5Department of Pharmacology and Toxicology, and
6Department of Chemistry, University of Toronto, Toronto, Ontario, Canada.
7Ontario Institute for Cancer Research, Toronto, Ontario, Canada.
Address correspondence to: Aaron D. Schimmer, Princess Margaret Cancer Centre, University Health Network, Room 8-706; 101 College St., Toronto, Ontario, Canada M5G 1L7. Phone: 416.946.44501 ext. 3996; Email: Aaron.schimmer@uhn.ca.
Authorship note: MT and VV contributed equally to this work.
Find articles by Ayoub, E. in: PubMed | Google Scholar
1Princess Margaret Cancer Centre,
2Krembil Brain Institute, University Health Network, Toronto, Ontario, Canada.
3Department of Molecular and Cell Biology, University of Guelph, Guelph, Ontario, Canada.
4Section of Molecular Hematology and Therapy, Department of Leukemia, The University of Texas MD Anderson Cancer Center, Houston, Texas, USA.
5Department of Pharmacology and Toxicology, and
6Department of Chemistry, University of Toronto, Toronto, Ontario, Canada.
7Ontario Institute for Cancer Research, Toronto, Ontario, Canada.
Address correspondence to: Aaron D. Schimmer, Princess Margaret Cancer Centre, University Health Network, Room 8-706; 101 College St., Toronto, Ontario, Canada M5G 1L7. Phone: 416.946.44501 ext. 3996; Email: Aaron.schimmer@uhn.ca.
Authorship note: MT and VV contributed equally to this work.
Find articles by Mak, P. in: PubMed | Google Scholar
1Princess Margaret Cancer Centre,
2Krembil Brain Institute, University Health Network, Toronto, Ontario, Canada.
3Department of Molecular and Cell Biology, University of Guelph, Guelph, Ontario, Canada.
4Section of Molecular Hematology and Therapy, Department of Leukemia, The University of Texas MD Anderson Cancer Center, Houston, Texas, USA.
5Department of Pharmacology and Toxicology, and
6Department of Chemistry, University of Toronto, Toronto, Ontario, Canada.
7Ontario Institute for Cancer Research, Toronto, Ontario, Canada.
Address correspondence to: Aaron D. Schimmer, Princess Margaret Cancer Centre, University Health Network, Room 8-706; 101 College St., Toronto, Ontario, Canada M5G 1L7. Phone: 416.946.44501 ext. 3996; Email: Aaron.schimmer@uhn.ca.
Authorship note: MT and VV contributed equally to this work.
Find articles by
Arruda, A.
in:
PubMed
|
Google Scholar
|

1Princess Margaret Cancer Centre,
2Krembil Brain Institute, University Health Network, Toronto, Ontario, Canada.
3Department of Molecular and Cell Biology, University of Guelph, Guelph, Ontario, Canada.
4Section of Molecular Hematology and Therapy, Department of Leukemia, The University of Texas MD Anderson Cancer Center, Houston, Texas, USA.
5Department of Pharmacology and Toxicology, and
6Department of Chemistry, University of Toronto, Toronto, Ontario, Canada.
7Ontario Institute for Cancer Research, Toronto, Ontario, Canada.
Address correspondence to: Aaron D. Schimmer, Princess Margaret Cancer Centre, University Health Network, Room 8-706; 101 College St., Toronto, Ontario, Canada M5G 1L7. Phone: 416.946.44501 ext. 3996; Email: Aaron.schimmer@uhn.ca.
Authorship note: MT and VV contributed equally to this work.
Find articles by
Kislinger, T.
in:
PubMed
|
Google Scholar
|
1Princess Margaret Cancer Centre,
2Krembil Brain Institute, University Health Network, Toronto, Ontario, Canada.
3Department of Molecular and Cell Biology, University of Guelph, Guelph, Ontario, Canada.
4Section of Molecular Hematology and Therapy, Department of Leukemia, The University of Texas MD Anderson Cancer Center, Houston, Texas, USA.
5Department of Pharmacology and Toxicology, and
6Department of Chemistry, University of Toronto, Toronto, Ontario, Canada.
7Ontario Institute for Cancer Research, Toronto, Ontario, Canada.
Address correspondence to: Aaron D. Schimmer, Princess Margaret Cancer Centre, University Health Network, Room 8-706; 101 College St., Toronto, Ontario, Canada M5G 1L7. Phone: 416.946.44501 ext. 3996; Email: Aaron.schimmer@uhn.ca.
Authorship note: MT and VV contributed equally to this work.
Find articles by Reed, M. in: PubMed | Google Scholar
1Princess Margaret Cancer Centre,
2Krembil Brain Institute, University Health Network, Toronto, Ontario, Canada.
3Department of Molecular and Cell Biology, University of Guelph, Guelph, Ontario, Canada.
4Section of Molecular Hematology and Therapy, Department of Leukemia, The University of Texas MD Anderson Cancer Center, Houston, Texas, USA.
5Department of Pharmacology and Toxicology, and
6Department of Chemistry, University of Toronto, Toronto, Ontario, Canada.
7Ontario Institute for Cancer Research, Toronto, Ontario, Canada.
Address correspondence to: Aaron D. Schimmer, Princess Margaret Cancer Centre, University Health Network, Room 8-706; 101 College St., Toronto, Ontario, Canada M5G 1L7. Phone: 416.946.44501 ext. 3996; Email: Aaron.schimmer@uhn.ca.
Authorship note: MT and VV contributed equally to this work.
Find articles by Carter, B. in: PubMed | Google Scholar
1Princess Margaret Cancer Centre,
2Krembil Brain Institute, University Health Network, Toronto, Ontario, Canada.
3Department of Molecular and Cell Biology, University of Guelph, Guelph, Ontario, Canada.
4Section of Molecular Hematology and Therapy, Department of Leukemia, The University of Texas MD Anderson Cancer Center, Houston, Texas, USA.
5Department of Pharmacology and Toxicology, and
6Department of Chemistry, University of Toronto, Toronto, Ontario, Canada.
7Ontario Institute for Cancer Research, Toronto, Ontario, Canada.
Address correspondence to: Aaron D. Schimmer, Princess Margaret Cancer Centre, University Health Network, Room 8-706; 101 College St., Toronto, Ontario, Canada M5G 1L7. Phone: 416.946.44501 ext. 3996; Email: Aaron.schimmer@uhn.ca.
Authorship note: MT and VV contributed equally to this work.
Find articles by Andreeff, M. in: PubMed | Google Scholar
1Princess Margaret Cancer Centre,
2Krembil Brain Institute, University Health Network, Toronto, Ontario, Canada.
3Department of Molecular and Cell Biology, University of Guelph, Guelph, Ontario, Canada.
4Section of Molecular Hematology and Therapy, Department of Leukemia, The University of Texas MD Anderson Cancer Center, Houston, Texas, USA.
5Department of Pharmacology and Toxicology, and
6Department of Chemistry, University of Toronto, Toronto, Ontario, Canada.
7Ontario Institute for Cancer Research, Toronto, Ontario, Canada.
Address correspondence to: Aaron D. Schimmer, Princess Margaret Cancer Centre, University Health Network, Room 8-706; 101 College St., Toronto, Ontario, Canada M5G 1L7. Phone: 416.946.44501 ext. 3996; Email: Aaron.schimmer@uhn.ca.
Authorship note: MT and VV contributed equally to this work.
Find articles by Kornblau, S. in: PubMed | Google Scholar
1Princess Margaret Cancer Centre,
2Krembil Brain Institute, University Health Network, Toronto, Ontario, Canada.
3Department of Molecular and Cell Biology, University of Guelph, Guelph, Ontario, Canada.
4Section of Molecular Hematology and Therapy, Department of Leukemia, The University of Texas MD Anderson Cancer Center, Houston, Texas, USA.
5Department of Pharmacology and Toxicology, and
6Department of Chemistry, University of Toronto, Toronto, Ontario, Canada.
7Ontario Institute for Cancer Research, Toronto, Ontario, Canada.
Address correspondence to: Aaron D. Schimmer, Princess Margaret Cancer Centre, University Health Network, Room 8-706; 101 College St., Toronto, Ontario, Canada M5G 1L7. Phone: 416.946.44501 ext. 3996; Email: Aaron.schimmer@uhn.ca.
Authorship note: MT and VV contributed equally to this work.
Find articles by Minden, M. in: PubMed | Google Scholar
1Princess Margaret Cancer Centre,
2Krembil Brain Institute, University Health Network, Toronto, Ontario, Canada.
3Department of Molecular and Cell Biology, University of Guelph, Guelph, Ontario, Canada.
4Section of Molecular Hematology and Therapy, Department of Leukemia, The University of Texas MD Anderson Cancer Center, Houston, Texas, USA.
5Department of Pharmacology and Toxicology, and
6Department of Chemistry, University of Toronto, Toronto, Ontario, Canada.
7Ontario Institute for Cancer Research, Toronto, Ontario, Canada.
Address correspondence to: Aaron D. Schimmer, Princess Margaret Cancer Centre, University Health Network, Room 8-706; 101 College St., Toronto, Ontario, Canada M5G 1L7. Phone: 416.946.44501 ext. 3996; Email: Aaron.schimmer@uhn.ca.
Authorship note: MT and VV contributed equally to this work.
Find articles by Vahidi, S. in: PubMed | Google Scholar
1Princess Margaret Cancer Centre,
2Krembil Brain Institute, University Health Network, Toronto, Ontario, Canada.
3Department of Molecular and Cell Biology, University of Guelph, Guelph, Ontario, Canada.
4Section of Molecular Hematology and Therapy, Department of Leukemia, The University of Texas MD Anderson Cancer Center, Houston, Texas, USA.
5Department of Pharmacology and Toxicology, and
6Department of Chemistry, University of Toronto, Toronto, Ontario, Canada.
7Ontario Institute for Cancer Research, Toronto, Ontario, Canada.
Address correspondence to: Aaron D. Schimmer, Princess Margaret Cancer Centre, University Health Network, Room 8-706; 101 College St., Toronto, Ontario, Canada M5G 1L7. Phone: 416.946.44501 ext. 3996; Email: Aaron.schimmer@uhn.ca.
Authorship note: MT and VV contributed equally to this work.
Find articles by Schimmer, A. in: PubMed | Google Scholar
Published June 16, 2026 - More info
J Clin Invest. 2026;136(15):e196687. https://doi.org/10.1172/JCI196687.
© 2026 Tcheng et al. This work is licensed under the Creative Commons Attribution 4.0 International License. To view a copy of this license, visit http://creativecommons.org/licenses/by/4.0/.
Received: June 11, 2025; Accepted: June 9, 2026


-
Results
Mitochondrial protein import is increased in primary AML compared with normal hematopoietic cells. Nucleus-encoded proteins destined for the mitochondria are imported into the organelle through a series of protein import channels and carriers (1, 2). We demonstrated that expression of all 1,144 nucleus-encoded mitochondrial genes was enriched in AML cells in a subset of patients with AML compared with normal bone marrow mononuclear cells. (Figure 1A). Genes associated with mitochondrial protein import were also upregulated in a subset of patients with AML (Figure 1B and Supplemental Figure 1A; supplemental material available online with this article; https://doi.org/10.1172/JCI196687DS1). Specifically, 38% of patients with AML had increased expression of genes associated with mitochondrial protein import compared with the 90th percentile expression in normal bone marrow mononuclear cells (Figure 1B). Genes and proteins associated with mitochondrial protein import were equally expressed across ELN2017 risk groups (17), cytogenetic subtypes, and morphologic subtypes of AML (Supplemental Figure 1, B and C). The average expression of mitochondrial protein import genes or proteins was not associated with survival for patients with AML (Supplemental Figure 1, D and E). Higher expression of mitochondrial protein import genes correlated with higher expression of mitochondrial genes (Figure 1C).
 Figure 1
Mitochondrial protein import and the UPRmt are increased in a subset of primary AML, compared with normal hematopoietic cells. (A) Enrichment plot of nuclear-encoded mitochondrial gene expression in primary AML (n = 542) and normal mononuclear bone marrow hematopoietic cells (n = 73) from GSE13159. (B) Violin plot of mitochondrial protein import gene expression (GO 0072655) in primary AML and normal mononuclear bone marrow hematopoietic cells from GEO GSE13159. The midline represents the median value. ***P = 4.9 × 10⁻⁴ using an unpaired, 2-tailed Student’s t test. (C) Enrichment plot of mitochondrial protein import genes in primary AML from GSE13159, stratified by mitochondrial gene expression. (D) Primary AML and normal mononuclear bone marrow hematopoietic cells were treated with puromycin (1 μg/mL) for 7.5 minutes, fixed, stained with anti-puromycin, anti-TOMM40 (mitochondria) antibodies, and DAPI (nucleus). Colocalization of puromycin and TOMM40 was detected by a PLA and confocal microscopy. Representative cells are shown. Scale bars: 10 μm. (E) Mean ± SD PLA punctae per cell from D in primary AML cell samples (n = 5) and normal mononuclear bone marrow hematopoietic cells (n = 5), quantified using HALO software (n = 82–154 cells per sample). (F) Violin plot of UPRmt gene expression in primary AML and normal mononuclear bone marrow hematopoietic cells from GSE13159. ***P = 1.1 × 10⁻³ using an unpaired, 2-tailed Student’s t test. (G) Correlation analysis of UPRmt and mitochondrial protein import gene expression in primary AML samples from GSE13159. (H) Violin plot of LONP1 mRNA expression in primary AML and normal bone marrow hematopoietic cells from GSE13159. ****P = 6.9 × 10⁻⁵ using an unpaired, 2-tailed Student’s t test. (I) Expression of LONP1 protein in primary AML cells (n = 39), normal hematopoietic cells (n = 14), and CD34+ progenitors (n = 3) was measured in cell lysates by immunoblotting. Expression was quantified by densitometry and displayed relative to LONP1 protein levels in OCI-AML2 cells. See Supplemental Figure 5B, Supplemental Table 2 (patient cytogenetics). Data are presented as mean ± SD.
Given the upregulation of genes associated with mitochondrial protein import in AML, we developed a proximity ligation assay (PLA) to quantify the import of newly synthesized proteins into the mitochondria. Newly synthesized proteins were labeled with puromycin, and a PLA assay was conducted to measure the interaction between puromycin-tagged proteins and the translocase of the outer mitochondrial membrane 40 (TOMM40) import channel. We validated the assay in AML cell lines (OCI-AML2, OCI-M2, TEX, and NB4), in which mitochondrial protein import and the PLA signal were blocked by treating cells with either cycloheximide to inhibit protein synthesis, or FCCP to reduce mitochondrial membrane potential and MitoBloCK-6 to inhibit the oxidase activity of GFER/Erv1 in the intermembrane space and thereby inhibit mitochondrial protein import similar to previously described (18–20) (Supplemental Figure 2). With this assay, we measured the import of newly synthesized proteins into the mitochondria of primary AML and normal mononuclear hematopoietic cells derived from consenting individuals donating peripheral blood granulocyte colony-stimulating factor (GCSF) mobilized hematopoietic stem and progenitor cells for allotransplantation. Compared with normal hematopoietic cells, mean mitochondrial protein import was 10-fold higher in primary AML cells (Figure 1, D and E).
UPRmt is upregulated in AML. Newly imported precursor proteins must be folded into their mature forms by mitochondrial proteases and chaperones to prevent protein aggregation (2, 21). The UPRmt is an evolutionarily conserved pathway that activates the nuclear transcription of mitochondrial proteases and chaperones in response to mitochondrial proteotoxic stress (7, 8, 22), including the stress from newly imported precursor proteins (23–25). Since there are no dedicated human UPRmt gene sets in the Gene Ontology (GO) and Kyoto Encyclopedia of Genes and Genomes (KEGG) databases, we compiled a 39-gene set of the known components of the UPRmt (Supplemental Figure 3A and Supplemental Table 1). Using this gene set, we measured UPRmt expression in primary AML and normal mononuclear bone marrow hematopoietic cell samples. UPRmt expression was higher in a subgroup of patients with AML compared with normal hematopoietic cell samples (Figure 1F and Supplemental Figure 3B). Thirty-two percent of patients with AML had increased UPRmt expression compared with the 90th percentile of normal bone marrow mononuclear hematopoietic cells (Figure 1F). UPRmt expression correlated with expression of the mitochondrial protein import machinery, reflecting the role of the UPRmt in protecting mitochondria from the influx of newly imported proteins (Figure 1G). UPRmt genes and proteins were equally expressed across AML ELN2017 risk groups (17), French-American-British (FAB) classification subtypes, and molecular mutation subtypes (Supplemental Figure 3, C and D). Increased UPRmt gene and protein expression was not associated with differences in survival of patients with AML (Supplemental Figure 3, E and F).
LONP1 is essential for a subgroup of AML cell lines and patient samples with high LONP1 expression. To understand the essentiality of the UPRmt in AML, we identified a core set of 18 genes that contributed to the positive enrichment of UPRmt in patients with AML with high levels of protein import (Supplemental Figure 4, A and B). This core set of 18 genes was also enriched and overexpressed in patients with AML, compared with normal adult bone marrow mononuclear hematopoietic samples (Supplemental Figure 4, C–E). We then ranked these 18 leading-edge genes in CRISPR and shRNA gene dependency screens (26). These datasets assign a score expressing a cell line’s dependence on a particular gene for survival. Genes with a score below –0.5 are considered essential (26). Of the 18 genes, 4 genes from the CRISPR screens (LONP1, DNAJA3, PMPCB, PMPCA) and 3 genes from the shRNA screens (LONP1, DNAJA3, PMPCB) had mean gene effect scores below –0.5 and were therefore essential to AML cell lines (Supplemental Figure 4F). Of the 18 genes, the mitochondrial protease LONP1 qualified as a top dependency in CRISPR and shRNA dependency screens and was selected for further analysis (Supplemental Figure 4G). LONP1 is a nucleus-encoded member of the AAA+ motor protein superfamily and is composed of 3 distinct domains: an N-terminal domain, a AAA+ domain, and a protease domain (27). LONP1 maintains mitochondrial proteostasis through progressive degradation of misfolded protein substrates, yet also collaborates with mitochondrial chaperones to regulate the folding of newly imported proteins (27, 28).
LONP1 mRNA expression was increased in a subgroup of patients with AML (Figure 1H and Supplemental Figure 5A). Specifically, in the GSE13159 and BeatAML2. datasets, LONP1 mRNA expression was increased in 32% and 34% of patients with AML, respectively, compared with the 90th percentile distribution in normal bone marrow mononuclear hematopoietic cells (Figure 1H and Supplemental Figure 5A). Similarly, by immunoblotting, LONP1 protein expression was increased more than 2-fold in 26 of 39 primary AML samples, compared with normal (n = 14) and CD34+ (n = 3) adult hematopoietic cells derived from consenting individuals who donated peripheral blood GCSF mobilized hematopoietic stem and progenitor cells for allotransplantation (Figure 1I and Supplemental Figure 5B). LONP1 mRNA and protein were equally expressed across AML ELN2017 risk groups (17), FAB morphologic subtypes, and molecular mutation subtypes (Supplemental Figure 6). LONP1 was equally expressed in individuals with relapsed versus newly diagnosed AML (Supplemental Figure 7A). Increased LONP1 protein expression was associated with decreased overall survival for patients with AML (Supplemental Figure 7B), but LONP1 mRNA expression was not correlated with survival (Supplemental Figure 7C). In primary AML samples, LONP1 expression positively correlated with the expression of mitochondrial protein import and UPRmt genes (Supplemental Figure 8).
We then evaluated the essentiality of LONP1 in AML. Knockdown of LONP1 with an shRNA reduced the growth and viability of OCI-AML2, OCI-M2, TEX, and NB4 cells (Figure 2A and Supplemental Figure 9, A and B). We also confirmed the essentiality of LONP1 in OCI-AML2 cells using CRISPR gene knockout (Figure 2A). The on-target activity of the shRNA was confirmed through rescue experiments with shRNA-resistant WT LONP1 (LONP1WT) cDNA (Supplemental Figure 9C).
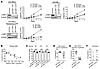 Figure 2
LONP1 is essential for a subgroup of AML cell lines and patient samples. (A) Mean ± SD growth and viability of OCI-AML2, OCI-M2, or Cas9-expressing OCI-AML2 cells by trypan blue staining after transduction with shRNA or sgRNA targeting LONP1 or control sequences. After 7 days (shRNA) or 14 days (gRNA), expression levels of LONP1 and β-actin were measured by immunoblotting. Representative data from 3 biological replicates are shown. (B) Primary AML samples (n = 9) were transduced with an shRNA targeting LONP1. After 7 days, cell viability was assessed by CellTiter-Fluor and LONP1 expression by immunoblotting. Basal protein expression before transduction relative to OCI-AML2 cells was calculated by densitometry. r2 = 0.71. (C) Normal hematopoietic samples (n = 3) were transduced with an shRNA targeting LONP1 or control sequences. After 7 days, the mean ± SD cell growth, and viability was measured by CellTiter-Fluor. P > 0.05, by unpaired, 2-tailed Student’s t test. (D) Equal numbers of primary AML cells transduced with an shRNA targeting LONP1 or control sequences in GFP-containing vectors were injected into right femurs of NSG mice (n = 8 per group). After 12 weeks, mice were sacrificed, and engraftment of CD45+CD33+ cells was measured in left femurs. Transduction efficiencies were 18.5% and 16.7% for shControl and shLONP1 3′-UTR groups, respectively. ***P = 0.0002, by unpaired, 2-tailed Student’s t test. (E) Equal numbers of primary AML cells from D were injected into the right femurs of NSG mice (n = 8 per group). After 12 weeks, left femur engraftment was measured. ****P < 0.0001, by unpaired, 2-tailed Student’s t test. (F) Equal numbers of cord blood cells transduced with shRNA targeting LONP1 or control sequences in GFP-containing vectors were injected into right femurs of NS-GF mice (n = 9 per group). After 12 weeks, left femur engraftment was measured. Transduction efficiencies were 38.5% and 37.6% for shControl and shLONP1 3′-UTR groups, respectively. P = 0.0988, by unpaired, 2-tailed Student’s t test. Data are presented as mean ± SD.
Furthermore, we demonstrated that LONP1 was essential for the growth of AML cell lines in vivo. Knockdown of LONP1 in OCI-AML2 and TEX decreased growth and engraftment of these cells in immune deficient mice (Supplemental Figure 9, D and E). Moreover, mice xenografted with OCI-AML2 cells after LONP1 knockdown survived longer than did mice xenografted with controls cells (Supplemental Figure 9F).
Finally, we assessed the essentiality of LONP1 in primary AML and normal adult hematopoietic cells. Primary AML and normal hematopoietic cells were transduced with an shRNA targeting LONP1 or control sequences. Seven days after transduction, we measured cell viability. We found that LONP1 was variably essential in primary AML samples and that sensitivity to LONP1 depletion correlated with basal levels of LONP1. Samples with the highest basal expression of LONP1 were most sensitive to LONP1 depletion, whereas samples with lower expression were insensitive (n = 9, r2 = 0.72) (Figure 2B). Normal adult hematopoietic cells expressed lower levels of LONP1 and were insensitive to LONP1 depletion (n = 3) (Figure 2C). We also assessed the effects of LONP1 depletion on the engraftment into mice of primary AML and normal hematopoietic cells. Knockdown of LONP1 decreased the engraftment of AML cells in primary and secondary engraftment studies, demonstrating an effect on the stem cell/progenitor population (Figure 2, D and E). In contrast, LONP1 knockdown did not inhibit the engraftment of human cord blood cells into NOD/SCID-3/GM/SF (NS-GF) marrow (Figure 2F).
Chemical inhibition of the LONP1 AAA+ domain kills AML cells with high LONP1 expression. The synthetic triterpenoid bardoxolone methyl is a known inhibitor of LONP1 and binds to an allosteric site near the AAA+ domain (Supplemental Figure 10A) (29). Omaveloxolone is structurally related to bardoxolone methyl and was recently approved by the FDA for the treatment of Friedreich’s ataxia, a neurodegenerative disease (Supplemental Figure 10A) (30). However, the effects of omaveloxolone on LONP1 have not been reported previously. We demonstrated that omaveloxolone and bardoxolone methyl selectively inhibited the ATPase activity of recombinant LONP1 with an IC50 of 0.79 ± 0.61 μM and 1.33 ± 0.70 μM, respectively (Figure 3A and Supplemental Figure 10B). As ATP hydrolysis is required for the proteolytic activity of LONP1, omaveloxolone and bardoxolone methyl, expectedly, also inhibited LONP1-mediated cleavage of FITC-casein with an IC50 of 1.32 ± 0.62 μM and 1.08 ± 0.31 μM, respectively (Figure 3B and Supplemental Figure 10B).
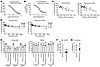 Figure 3
Chemical inhibition of the LONP1 AAA+ domain preferentially targets AML cells with high LONP1 expression. (A and B) Mean ± SD (A) ATPase activity and (B) proteolytic activity of recombinant LONP1 in the presence of omaveloxolone or bardoxolone methyl. (C) Primary AML samples were treated with 250 nM omaveloxolone (n = 16) or bardoxolone methyl (n = 30) for 72 hours. Cell growth and viability was measured by CellTiter-Fluor and LONP1 protein expression relative to OCI-AML2 cells by immunoblotting. (omaveloxolone: r2 = 0.66, bardoxolone methyl: r2 = 0.65). (D) Normal mononuclear hematopoietic cells (n = 3) were treated with omaveloxolone or bardoxolone methyl. After 72 hours, cell growth and viability were measured by CellTiter-Fluor. (E) Primary AML samples (n = 3) or normal mononuclear hematopoietic cells (n = 3) were treated with 200 nM omaveloxolone or bardoxolone methyl and plated for clonogenic growth assays. AML130433 cells (omaveloxolone: ***P = 0.0004; bardoxolone methyl: ***P = 0.0002); AML161868 cells (omaveloxolone, bardoxolone methyl: ****P < 0.0001); AML90784 cells (omaveloxolone: ***P = 0.0003; bardoxolone methyl: *P = 0.0239). NS, P > 0.05; 1-way ANOVA with Dunnett’s multiple-comparison test. (F) Primary AML cells were injected into the right femurs of NSG mice (n = 5–8 per group). After 6 weeks, mice were treated i.p. with omaveloxolone (7.5 mg/kg) or vehicle daily for 6 days. On day 7, engraftment of primary AML cells in the left femur was assessed with flow cytometry and anti–human CD45 and CD33 antibodies. ***P = 0.0009, by unpaired, 2-tailed Student’s t test. (G) Cord blood cells were injected into the right femurs of NS-GF mice (n = 8–10 per group). After 4 weeks, mice were treated with omaveloxolone (7.5 mg/kg) or vehicle for 8 weeks. Engraftment of cord blood cells in the left femur was assessed with flow cytometry and anti–human CD45 and CD33 antibodies. NS, P = 0.3091, by unpaired, 2-tailed Student’s t test. Data are presented as mean ± SD.
We evaluated the effects of omaveloxolone and bardoxolone methyl on the growth and viability of AML cell lines. Omaveloxolone and bardoxolone methyl reduced the growth and viability of AML cells (OCI-AML2, OCI-M2, TEX, and NB4) (Supplemental Figure 10, C and D). Moreover, omaveloxolone synergized with the clinically approved anti-AML therapeutic venetoclax to increase AML cell death (Supplemental Figure 10E). While omaveloxolone and bardoxolone methyl have targets beyond LONP1 (31, 32), at low concentrations at or below the IC50, cell death from these drugs was specific for LONP1. At low concentrations, no further cell death was observed when treating OCI-AML2 cells depleted of LONP1. However, at higher concentrations, these drugs killed OCI-AML2 cells lacking LONP1 (Supplemental Figure 10, F–I), consistent with additional mechanisms of action at higher concentrations.
Next, we assessed the effects of these inhibitors on primary AML and normal adult hematopoietic cells. Omaveloxolone and bardoxolone methyl killed a subgroup of primary AML cells from patient samples, and sensitivity to these drugs correlated with the basal expression of LONP1. Samples with the highest LONP1 expression were most sensitive to omaveloxolone (n = 16, r2 = 0.64) and bardoxolone methyl (n = 30, r2 = 0.65) (Figure 3C). In contrast, inhibition of LONP1 with these drugs did not reduce the viability of adult normal hematopoietic cells obtained from consenting individuals donating peripheral blood GCSF–mobilized hematopoietic stem and progenitor cells for allotransplantation (Figure 3D). Omaveloxolone and bardoxolone methyl also inhibited the clonogenic growth of primary AML cells (n = 3) (Figure 3E). In contrast, the clonogenic growth of normal adult hematopoietic cells (n = 3) was not impaired by these drugs (Figure 3E).
Finally, we investigated the effects of systemic administration of LONP1 inhibitors in mouse models of AML. Mice xenografted with TEX, OCI-AML2, or primary AML cells were treated with either omaveloxolone or bardoxolone. Both compounds decreased tumor growth and engraftment of OCI-AML2, TEX, and primary leukemic cells in immune-deficient mice (Figure 3F and Supplemental Figure 11, A–C). LONP1 inhibition also prolonged survival of mice engrafted with AML cells (Supplemental Figure 11, D and E). In contrast, inhibition of LONP1 did not reduce the engraftment of normal cord blood cells (Figure 3G). At concentrations of omaveloxolone and bardoxolone methyl that decreased the leukemia burden, no reductions in body weights of the mice or changes in their behavior or organ histology were observed (Supplemental Figure 11, F and G).
Inhibition of LONP1 leads to the accumulation of aggregated mitochondrial proteins in AML cells with high LONP1 expression. LONP1 acts in concert with chaperones to solubilize mitochondrial protein precursors by folding them into mature proteins (27, 33, 34). To understand the effect of inhibiting LONP1 on mitochondrial protein solubility and aggregation, we developed an assay to visualize insoluble protein aggregates in the mitochondria. Cells were stained with proteostat, a dye that fluoresces when intercalated with aggregated proteins and Alexa Fluor 488–labeled anti-TOMM20 to mark the mitochondria. The colocalization of proteostat and TOMM20 was visualized with confocal microscopy, and the intensity of the colocalized signal was quantified by HALO image analysis software.
We did not observe aggregated mitochondrial proteins in untreated AML cell lines or primary samples, suggesting that the UPRmt and LONP1 were sufficient to maintain mitochondrial protein solubility under basal conditions. However, upon genetic depletion or chemical inhibition of LONP1, mitochondrial protein aggregates increased in AML cell lines (OCI-AML2, OCI-M2, TEX, NB4) (Figure 4A and Supplemental Figure 12–14). Likewise, inhibition of LONP1 with omaveloxolone or bardoxolone methyl induced mitochondrial protein aggregation in primary AML cells. We also observed increased mitochondrial protein aggregation in TEX cells and primary AML cells xenografted into mice treated with omaveloxolone (Supplemental Figure 15).
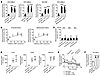 Figure 4
Inhibition of LONP1 leads to the accumulation of aggregated mitochondrial proteins in AML cells with high LONP1 expression. (A) OCI-AML2 or OCI-M2 cells were transduced with shRNA or sgRNA targeting LONP1 or control sequences or treated with 250 nM omaveloxolone or bardoxolone methyl. After 7 days (shRNA) or 14 days (gRNA) or 30 hours (chemical inhibition), cells were stained with proteostat (aggregated proteins) and FITC anti-TOMM20 (mitochondria). Cells were imaged by confocal microscopy, and colocalization of proteostat with TOMM20 was quantified by HALO software. ****P < 0.0001, by 1-way ANOVA with Dunnett’s multiple-comparison test. (B) Primary AML samples (n = 8) were treated with 250 nM omaveloxolone or bardoxolone methyl for 30 hours. Mitochondrial protein aggregation was measured as in A, and LONP1 expression relative to OCI-AML2 cells was measured by immunoblotting (omaveloxolone: r2 = 0.64; bardoxolone methyl: r2 = 0.65). (C) Normal mononuclear hematopoietic cells were treated with 250 nM omaveloxolone for 30 hours. Mitochondrial protein aggregation was measured as in A. NS, P > 0.05, by unpaired, 2-tailed Student’s t test. (D) OCI-AML2 cells were transduced with an shRNA targeting LONP1 or control sequences. After 7 days, LONP1 substrates (CLPX, TUFM, NDUFA9) were measured in detergent-insoluble fractions of mitochondrial lysates (Supplemental Figure 18) and quantified by densitometry. Data represent the mean ± SD of 3 biological replicates. CLPX: shLONP1 1755 (*P = 0.0152), shLONP1 3′-UTR (**P = 0.034); TUFM: shLONP1 1755 (**P = 0.0015), shLONP1 3′-UTR (***P = 0.0004), NDUFA9: shLONP1 1755 (***P = 0.0005), shLONP1 3′-UTR (***P = 0.0004) by 1-way ANOVA with Dunnett’s multiple-comparison test. (E) OCI-AML2 cells were transduced with an shRNA targeting LONP1 or control sequences. After 7 days, the oxygen consumption rate was measured (n = 14–18 per group). (F) OCI-AML2 cells were transduced with an shRNA targeting LONP1 or control sequences. After 7 days, mitochondrial superoxide levels were measured by flow cytometry using MitoSOX reagent. ***P = 0.0001, by 1-way ANOVA with Dunnett’s multiple-comparison test. Data are presented as mean ± SD.
In primary AML, the increase in aggregated mitochondrial proteins after LONP1 inhibition positively correlated with the basal expression of LONP1 (omaveloxolone: n = 8, r2 = 0.66; bardoxolone methyl: n = 8, r2 = 0.65) (Figure 4B and Supplemental Figures 16 and 17). In contrast to the effects on AML, inhibiting LONP1 with omaveloxolone did not induce mitochondrial protein aggregation in normal adult hematopoietic cells (Figure 4C and Supplemental Figure 17).
We next assessed the effect of LONP1 depletion on the aggregation of specific LONP1 substrates. AML cell lines (OCI-AML2, OCI-M2, TEX, and NB4) were transduced with an shRNA or gRNA targeting LONP1 or control sequences. After transduction, mitochondrial lysates were separated into detergent-soluble and insoluble fractions. As a positive control for the aggregated protein, isolated mitochondria from cells transduced with control sequences were heat shocked at 45°C. We measured the levels of LONP1 substrates (CLPX, TUFM, and NDUFA9) in the fractions by immunoblotting and quantified them by densitometry. Genetic depletion of LONP1 decreased the abundance of substrates in the soluble fraction and promoted their accumulation in the insoluble fraction, consistent with their aggregation (Figure 4D and Supplemental Figures 18 and 19).
LONP1 substrates, such as NDUFA9, TUFM, and CLPX, are critical components of mitochondrial metabolism and oxidative phosphorylation (33, 34). As LONP1 inhibition reduced soluble levels of its substrates, we measured mitochondrial respiration and ROS production after LONP1 knockdown. Depletion of LONP1 reduced basal and maximal respiration and increased ROS production in OCI-AML2 cells (Figure 4, E and F).
The LONP1 AAA+ domain is necessary for mitochondrial protein solubility. We next determined which domain of LONP1 is necessary for maintaining mitochondrial protein solubility. We engineered OCI-AML2 cells by overexpressing cDNA corresponding to WT LONP1 (LONP1WT), ATPase-deficient LOPN1 (LONP1E591A), or proteolytically deficient LONP1 (LONP1S855A) and subsequently knocked down endogenous LONP1 using an shRNA targeting the 3′-UTR of the endogenous gene. Overexpression of the LONP1 constructs and depletion of endogenous LONP1 were confirmed by immunoblotting (Figure 5A). We confirmed that the E591A mutation selectively abolished the ATPase activity of the enzyme and that the S855A mutation selectively abolished the protease activity (Supplemental Figure 20, A and B).
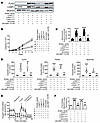 Figure 5
The LONP1 AAA+ domain, but not the protease domain, is necessary for mitochondrial protein solubility. (A) OCI-AML2 cells were transduced with empty vector, FLAG-tagged WT cDNA (LONP1WT), ATPase-deficient (LONP1E591A) cDNA, or protease-deficient LONP1 cDNA (LONP1S855A). Fourteen days later, cells were transduced with either an shRNA targeting the 3′-UTR of endogenous LONP1 or control sequences. After 7 days, levels of LONP1 and MnSOD protein were measured in mitochondrial lysates by immunoblotting. A representative immunoblot from 3 biological replicates is shown. (B) Mean ± SD growth and viability of cells from A were measured by trypan blue staining. Representative data from 3 biological replicates are shown. (C) Cells from A were stained as in Figure 4A to assess mitochondria-localized protein aggregation (n = 122–166 cells per group). ****P < 0.0001 (empty vector+shControl vs. empty vector+shLONP1 3′-UTR or LONP1E591A+shLONP1 3′-UTR); NS, P > 0.05 (empty vector+shControl vs. LONP1WT+shLONP1 3′-UTR or LONP1S855A+shLONP1 3′-UTR), by 1-way ANOVA with Dunnett’s multiple-comparison test. (D) Levels of CLPX, TUFM, and NDUFA9 protein in the detergent insoluble fraction of isolated mitochondria from cells in A were measured by immunoblotting (n = 3). CLPX: **P < 0.01 (empty vector+shControl vs. empty vector+shLONP1 3′-UTR or LONP1E591A+shLONP1 3′-UTR); NS, P > 0.05 (empty vector+shControl vs. LONP1WT+shLONP1 3′-UTR or LONP1S855A+shLONP1 3′-UTR). TUFM: ***P < 0.001 (empty vector+shControl vs. empty vector+shLONP1 3′-UTR or LONP1E591A+shLONP1 3′-UTR); NS, P > 0.05 (empty vector+shControl vs. LONP1WT+shLONP1 3′-UTR or LONP1S855A+shLONP1 3′-UTR). NDUFA9: ***P = 0.0004 (empty vector+shControl vs. empty vector+shLONP1 3′-UTR); *P = 0.0179 (empty vector+shControl vs. LONP1E591A+shLONP1 3′-UTR); NS, P > 0.05 (empty vector+shControl vs. LONP1WT+shLONP1 3′-UTR or LONP1S855A+shLONP1 3′-UTR). (E) Oxygen consumption of cells from A was measured with a Seahorse Metabolic Flux Bioanalyzer (n = 9–15 wells per group). (F) Mitochondrial superoxide in cells from A was assessed as in Figure 4F. ****P < 0.0001 (empty vector+shControl vs. empty vector+shLONP1 3′-UTR or LONP1E591A+shLONP1 3′-UTR); NS, P > 0.05 (empty vector+shControl vs. LONP1WT+shLONP1 3′-UTR or LONP1S855A+shLONP1 3′-UTR) by 1-way ANOVA with Dunnett’s multiple-comparison test. Data are presented as mean ± SD.
Overexpression of LONP1S855A, which retains a functional AAA+ domain, rescued OCI-AML2 cells from LONP1 depletion. These cells did not accumulate aggregated mitochondrial proteins or ROS and maintained normal oxygen consumption. These cells also proliferated normally. In contrast, overexpression of LONP1E591A, which retains an intact proteolytic site, failed to rescue OCI-AML2 from LONP1 inhibition. These cells displayed increased mitochondrial protein aggregation, increased ROS, decreased oxygen consumption, and decreased cell growth and viability (Figure 5, B–F, Supplemental Figure 20, C and D, and Supplemental Figure 21). Thus, taken together, the LONP1 AAA+ domain was necessary to maintain mitochondrial protein solubility, mitochondrial function, and cell viability, whereas a functional protease domain was not essential.
Normal tissues have lower LONP1 levels and do not require LONP1 to maintain mitochondrial protein solubility. Finally, to understand why normal tissues were not dependent on LONP1, we measured LONP1 levels in normal murine tissues. LONP1 expression was lower in normal mitochondria-rich murine tissues (liver, brain, heart) compared with OCI-AML2 and A20 murine leukemia/lymphoma cells (Figure 6A). Of note, human and murine LONP1 share 81% LONP1 sequence homology (35), and we found that omaveloxolone increased mitochondrial protein aggregation and decreased the growth and viability of A20 murine leukemia cells, similar to human AML cells, confirming cross-reactivity with murine LONP1 (Supplemental Figure 22).
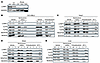 Figure 6
Systemic administration of LONP1 inhibitors reduces growth and increases mitochondrial protein aggregation in malignant cells while sparing normal cells. (A) LONP1 and Manganese Superoxide Dismutase (MnSOD) expression in mitochondria isolated from A20 and OCI-AML2 cells, and cells from liver, brain, and heart of SCID mice. (B–E) OCI-AML2 cells were injected s.c. into the flanks of SCID mice. One week after injection, mice were treated with 7.5 mg/kg omaveloxolone, bardoxolone methyl, or vehicle control daily for 6 consecutive days. Mitochondria were isolated from (B) OCI-AML2 tumors and murine (C) heart, (D) brain, and (E) liver. Levels of LONP1, CLPX, TUFM, NDUFA9, and MnSOD were measured in total (MT), soluble (S), and insoluble pellet (P) fractions of mitochondrial lysates. Data are presented as mean ± SD.
We also measured changes in mitochondrial protein aggregation in murine tissue after treatment with omaveloxolone and bardoxolone methyl. Mice xenografted with OCI-AML2 cells were treated with omaveloxolone or bardoxolone methyl daily for 6 days. After treatment, mitochondria from the leukemic cells as well as mouse livers, brains, and hearts were harvested. We found that both drugs increased aggregation of LONP1 substrates in the leukemic cells (Figure 6B). In contrast, mitochondrial protein aggregates did not accumulate in murine tissues (Figure 6, C–E). Thus, taken together, LONP1 inhibition led to mitochondrial protein aggregation in AML cells with high LONP1 expression. In contrast, normal tissues expressed lower levels of LONP1 and did not accumulate mitochondrial protein aggregates upon LONP1 inhibition, thus explaining the therapeutic window for this target.
In conclusion, cells from a subgroup of patients with AML had increased mitochondrial protein import and upregulation of the UPRmt to counter the stress of newly imported proteins. Targeting components of the UPRmt, such as LONP1, led to increased mitochondrial protein aggregation and cell death in this subset of cells.


Copyright © 2026 American Society for Clinical Investigation
ISSN: 0021-9738 (print), 1558-8238 (online)